Showing posts with label prison. Show all posts

Friday, August 22, 2025

Examining Racial and Ethnic Reality Part 2: Employment, Politics, Crime, Poverty, Home Ownership, Conclusion and Future


In part two of our look at race and ethnic reality, we'll take a look at employment and unemployment, Affirmative Action and quotas, racial equality in politics, crime  and prison sentencing, poverty, welfare, housing, and who really benefits the most? Finally, we’ll address the issues of reparations, the future of race relations, and what does all this mean, if anything?

Employment

When it comes to labor force participation, 63.1% of Blacks are in the work force. 65% of Asians are actively involved as are 62.3% of White and 66.9% of Hispanics. Meanwhile, 65.3% of those who claim to be mixed race participate in the work force.

Whites and Asians occupy the majority of professional and managerial jobs with Asians holding most of the STEM and healthcare professions while Blacks fill most of the community and social services occupations (Black males work the majority of transportation and utility jobs while Hispanics dominate the construction and hospitality industries per the U.S. Bureau of Labor Statistics).  

Examining income levels by race (based on 2023 data), we find that the median household income for Whites nationally is $89,050. For Hispanics, it’s $65,450. The median income for Black households is $56,490. Native Americans earn $57,270.  The highest household income belongs to Asians which averages $108,700.

The national unemployment rate is 4%. Among Whites, it’s 3.6% and 3.5% for Asians. In the Hispanic community, the unemployment rate is 4.6% (4.9% for Mexicans and 5.9% for Puerto Ricans). However, the highest percentage of unemployment belongs to Black Americans with an average of 6%.

Affirmative Action and Quotas

Affirmative Action came into being through two separate measures. First in 1961 when President John Kennedy signed Executive Order 10925 which required government contractors ensured equal employment opportunities  for all applicants. Second was in 1965 when President Lyndon Johson signed into law Executive Order 11246 prohibiting employment discrimination by federal contractors and requiring them to adopt a plan to employ minorities. By the 1980’s, this had been expanded to include gender and religion. It was also expanded to include education and other areas. Basically, it federal dollars touched it, there had to be an affirmative action plan in place.

Some institutions used this as a de facto “quota” system, rather than as intended. Thus, individuals were hired or accepted based not on their skills, experience, or test scores, but on skin color and gender. The overall result was a drop in performance which affected productivity and employability. Fortunately, that was done away with by the Supreme Court  in a 2023 ruling against Harvard College. At long last, ability returned to the forefront.    

Politics

What about politics? Whites make up about 59.3% of the population. Hispanics are 18.9%. Blacks comprise 12.6%, and Asians are about 5.9%. When we look at the make up of Congress, of the 431 members, 301 identify as White. 61 are Black, 46 are Hispanic, 18 are Asian, and 5 say they are racially mixed.

 Of the 99 Senate members, 83 are White. 7 are Hispanic, while 5 are Black and 3 are Asian with 1 Native American (not including Elizabeth Warren), and of course, there was Barack Obama who was bi-racial although popularly identified as Black.

When it comes to federal judges, the majority (65.80%) are white. 14.44% are black. 9.11% are Hispanics. 6.63% are Asian, 2.84% are mixed race, and an embarrassing 0.47% are Native American. Additionally, 52.7% of federal judges are male. Currently, there is one Black governor, one Native American, and one Hispanic.

Crime and Punishment

When it comes to crimes, Black Americans were 50% more likely to be victims of non-lethal violent crimes than Whites according to a report by the Council for Criminal Justice (CCJ). In both instances, the assailant was more likely to be a black male than not. In comparing Hispanics and Blacks, Blacks were 40% more likely to be the victim than Hispanics.

There was no difference in non-lethal victimization between Hispanics and whites although Hispanics were 2x more likely to be robbed than Whites whereas Black females were twice as likely as Hispanic females to be the victim of rape or sexual assault. In short, Blacks were more likely than other races or ethic groups to be a victim of crime while at the same time, most likely to have been the perpetrator of the crime.

An FBI Uniform Crime Report from 2019 seemed to back up the CCJ data. According the UCR, Black Americans accounted for 55.9% of all murders committed. Whites accounted for 44.1%. When it came to the race of the victim, 54.7% were Black while 42.3% were White, and roughly 3% were “other”. The pre-capita “offending rate” was eight times that of whites as were their victim rate meaning that statistically, Blacks (especially males) were more likely to commit violent crime than any other race and that Blacks in general were more often than not to be the victim of a violent crime.

According to a victimization report conducted in 2004, blacks were 56% more likely to be the offenders when it came to carjackings compared to 21% for Whites and 16% for Asians. Blacks were 12% more likely than any other races to commit an armed robbery. Hispanics, on the other hand, comprised 40% of those sentenced for federal crimes.

Per a report by The Sentencing Project, Blacks are the most incarcerated group in America. Black offenders are 5 times more likely than Whites to be sentenced to prison. Hispanics will go to prison almost 2.5 times more often than White offenders. Native Americans will be incarcerated more often than Whites but less than Hispanics.

Blacks are also more likely to be jailed on misdemeanor charges than any other group, but they are also more likely to violate probation. Hispanics are more likely than not to serve time in a federal prison. Asians are least likely to be jailed for any reason.

Black women are more likely than White or Hispanic women to do time. Asian women behind bars are virtually a statistically null category. The Sentencing Project also reports that while there has been a decline in incarceration rates overall, the Black prison population has declined the most.

Echoing the above, the Prison Policy Initiative pointed out that while Blacks are roughly 13% of the U.S. population, they make up 37% of those behind bars. However, based on percentage of population, a discorporate number of Native Americans are incarcerated compared to any other race or ethnic group. Lastly, it should be noted that the U.S. imprisons more of its population than any other country on the planet bar none.

So, with legislation like the Civil Rights Act of 1964, the Voting Rights Act of 1965, Affirmative Action, federal incentives for Historical Black colleges, and various federal and state programs, not to mention academic courses and majors, why isn’t the situation better?

Black, Hispanic, and Asian enterprises have been extremely successful. The Federal Office of Advocacy reported in 2022 that there were 5 million Hispanic owned businesses employing some 3 million individuals. Latinos are also the largest entrepreneurial demographic in the U.S.. There are 3.4 million Asian and Pacific Islander owned businesses in America, employing 5.3 million, and generating earnings of $1.2 trillion dollars annually.

Native American owned businesses, of which there are over 340,000, have earnings of some $46 billion annually despite representing roughly 7% of the total population.  As for Blacks businesses, there are approximately 3.12 million according to the Census Bureau. They provide 3.56 million jobs while producing $206 billion in annual revenue.  Of course that doesn’t include cable channels, print media, radio stations, music and movie genres, events, pageants, business associations, advocacy groups, and so forth which are dedicated to a specific racial or ethnic group.

Lastly, White owned businesses. Currently about 82% of all businesses in the United States are White owned, including 85% of all small businesses. Together, they generate about $1.3 trillion dollars while employing around 21.9 million workers. Given that Whites are by far still the largest demographic, that shouldn’t come as a surprise.

Poverty

The highest poverty rate in the U.S. belongs to Native Americans with 22% living at or below the poverty line. Black Americans are next with 17.9% in poverty. Hispanics have a poverty rate of 16.9%. The poverty rate for Asian Americans was 9.1%.  Whites had the lowest poverty rate at 7.7%.

When we look at those who receive the most government assistance such as Welfare, WIC, energy or rent assistance, or SNAP, Whites are the greatest beneficiaries at 43% (this is also due to their largest percentage of the population). They are also the group mostly likely to leave the poverty rolls and drop government assistance programs.

In terms of SNAP or “food stamps” alone, White make up 62.7% of recipients. Hispanics are 39.8%. Black Americans make up 27% while just 3.8% are of Asian origin. 6.6% are of other races including Native American. It’s bears mentioning that 87.8% are native born.

Hispanics are the second largest users of government assistance at 26%. They are followed by Black Americans at 23%. Finally, Asian Americans. They are just 8% users of taxpayer based services.

Home Ownership

Lastly, let’s look at home ownership. According to the National Association of Home Builders, 65.7% of Americans owned their own home as of 2023. When broken down by race, using data from the U.S. Census Bureau, White Americans were 73.8% of all homeowners. Asian Americans were 63%. Hispanics were 49.8% while Black Americans were slightly behind at 45.9%.

Hispanics also saw the greatest increase of homeownership or any group. Black home ownership has also increased while slowing for Whites and Asians (one explanation it that the aging White population is shifting to low maintenance residences like apartments, condominiums, or assisted living facilities).  

Conclusion

According to the numbers, Whites remain the largest racial demographic, and as such, dominate in most of the categories, including use of government services and prison population, as one would expect based on the population size (note too that there are large pockets White communities, such as in Appalachia or the Ozarks, which resemble more of a third world nation than a top tier one).

In looking at education, Asian Americans, the smallest demographic, outperforms every other racial group relative their size in terms of education, labor market participation, income, own a home, or hold a managerial or professional position.  At the same time, they are least likely to be a criminal offender, got to jail/prison, or use government assistance.  

Hispanics, the second largest demographic, is most likely to use some form of taxpayer based serves, hold service or construction jobs. They are growing most rapidly of any other group in terms of home ownership. They also make up the majority of the labor market while having the third highest unemployment rate.  They have the third highest graduation rates behind Asian Americans and Whites. In terms of politics, they hold the second most number of seats in Congress.

On the downside, Hispanics (especially males) are more likely than other groups to be convicted of a felony and sentenced to a federal prison (usually on immigration or drug related charges). They are ranked third in terms of poverty. Lastly, they are the second highest racial minority  over all to be a victim of a non-lethal crime.

From being  statistically insignificant just 50 years ago, Hispanics have become a powerful force in American culture. Within the next 50 years, they will be on par with Whites in terms of population and likely a powerful player in politics, perhaps having the largest racially based caucus.  There’s no question they’ll regularly hold the Oval Office.

Black Americans, for various reasons, haven’t been able to gain any significant traction socially. They do well when if comes to the number of live births but also lead in terms of illegitimate children. They also have the highest divorce rates while, despite the myth to the contrary, Black fathers are the most active in the lives of their children.

They have an impressive graduation rate yet hold the least number of top level jobs. Black females are also most likely to outperform Black males, but also most likely to be harassed by them as well. They also have the third largest number of individuals in the labor market with the lowest income level or any group. When it comes to poverty, they’re the second highest. However, they are not the “Welfare Queens” they are portrayed as.

In terms of politics, they’ve had decent success, though it’s come in waves, with success in Congress, judgeships, mayoral offices, and even the presidency.  However, these gains are often negated by charges of corruption, drug and alcohol abuse.

When it comes to crimes, Blacks (particularly males) lead the pack, most notably when the victims are also black. They are also most likely to be sentenced to prison, skip bail, or violate probation. Thus, they don’t seem to get the break other groups get.

However, Blacks aren’t the worse off. That goes to Native Americans. They have some of the lowest birth rates, the poorest schools, least number of job opportunities, highest poverty and homeless levels of any racial or ethnic demographic. They also experience the highest school drop out rates. Their overall income levels have improved (thanks largely to legalized gaming). Nevertheless, their representation in politics is and has been negligible.

In the end, each race can boost of a certain measure of success and bemoan its failures. Is there any justification for “reparations”? If we mean as a result of self-inflicted failure, then no. That’s on them, not society. The opportunities are there.  The problem is not taking responsibilities for outcomes. It’s not demanding quality and rewarding success, be it in education, job ownership, or self-care.

They must self-police neighborhoods and create acceptable role models. If they don’t care, why should society? Case in point, look at Asian neighborhoods and schools.  If, on the other hand,  we mean reparations because of governmental abuse or apathy, then yes, and Native Americans would be that group.

They’ve been the subject of land theft, blatant lies, attempted genocide through starvation and disease, and enforced poverty.  They’ve had their culture stripped away. They’ve been denied the opportunities others have taken for granted. Where they’ve succeeded, it’s where they’ve stepped up and took charge…and responsibility…for their situation, handling their own affairs, and keeping the government at arm’s length as much as possible.  

If we continue along the same path, America will slowly, but assuredly, balkanize. For Whites, most everything will remain largely the same despite a slow decline into pockets here and there. Hispanics will settle into their position of co-parity with Whites. Their language and culture will be common place. Parts of the U.S. will be de facto “El Norte” (or “Aztlan” as it’s called”). Asians will dominate the West Coast while a shrinking Black population will occupy some of the larger cities, especially in the Rust belt, looking like they belong more to some dystopian movie or third world country than to the United States. 

Thank you for reading "Another Opinion", the Op/Ed blog page for the "militant middle".  Here at "A/O" we truly value our readers. At A/O we seek the facts as they exist, not partisan talking points.  We hope you find our articles informative and engaging. Comments are welcome, provided they are not vulgar, insulting or demeaning.  Another Opinion is offered without charge and is directed toward all independent and free-thinking individuals. We ask, however, that you "like" us on whatever platform you found us on in order to keep our articles available for free to others. Lastly, in order to keep costs down, we depend on passive marketing, and therefore, depend on our readers to please forward our posts along. Below you will find links to the sources we used in writing this article. Thank you. 


Louisiana Law Review: Race Quotas as a Form of AffirmativeAction


Race and crime in the United States


A Brief History of Affirmative Action


U.S. Poverty Statistics


Fact Check: Are Black people the majority of those onwelfare?


What the data says about food stamps in the U.S.


Homeownership by race and ethnicity


Saturday, August 12, 2023

"Stop Acting White!" Has Race Comparison Contributed to Black Academic Failure?

Have you ever heard the expression "stop acting white"? It is typically a remarks most often heard in black communities, and you can bet it isn't being said as a compliment. It's also come up in several corporate diversity projects such as Coke's infamous online training blunder which was hosted on LinkedIn back  in 2021 (link below).

Although education is typically held up as the gateway to success, there seems to be those who do well in school that are seen as somehow "betraying" their race (as if failing is something to aspire to). However, some claim that is purely a cultural myth, but let's look further.

According to the U.S. Census Bureau, Black Americans, who are the second largest minority at 13.6% of the population, have the second highest poverty rate of any group at 25.8%. The largest are Native Americans and Native Alaskans at 27% while comprising only 2.9% of the total population.

The National Center for Educational Statistics reports that the dropout rate among black students between the ages of 16 and 24 is currently 5.9% (down from 10.3% in 2021). For Hispanic students in the same age bracket its 7.8%, a drop from 16.7%. Among Native Americans and Native Alaskans, it's deceased from 15.4% to 10.2%, which is still extremely high given their small population numbers.

White kids have a dropout rate of 4.1%, down from 5.3%. Asians have the lowest dropout rate of any group at 2.1% from a "high" of 2.8%. Lastly, among children of two or more races, the report indicated they had a dropout rate in 2021 of 6.1% to a current rate of 4.9%. Lastly, let's look at incarceration rates.

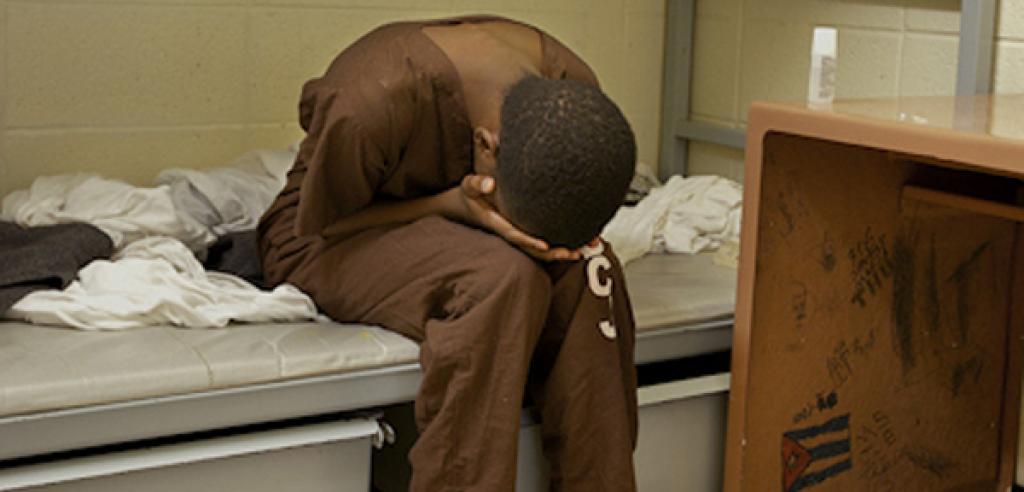
America has the dubious "honor" of having the highest incarceration rate of any nation in the world. More than Russia. More than Iran.  More than China or even North Korea.  The largest minority population in prison are black males who, at 38.5% of the prison population, make up 1 of every 15 inmates.  Native Americans  are 2.6% of all inmates, which again is a unusually large amount given the relative size of the Native American population.

While making up 19% of the U.S. population, Hispanics represent 1 in 36 of every inmate or about 29.9% of those behind bars.  Yet, while white males are the largest population behind bars, comprising 57.4%  of inmates, blacks are incarcerated at a rate of 5x their white counterparts (as an aside, Hispanics are jailed at just 1.3x that of whites). 1 out of every 81 black adult has served time somewhere.   In 12 states (Alabama, Georgia, Delaware, Illinois, Maryland, Michigan, New Jersey, Mississippi, Virginia, Louisiana, South Carolina, and North Carolina) blacks make up half of the total prison population.

According to the Bureau of Justice Statistics, 41% of all inmates are high school dropouts (the national average is just 18%) while 22% have a high school diploma or GED.  Females were more likely to have graduated from high school or have earned a GED while 68% of all males did not.

When broken down by race, we find that 44% of black inmates lack a high school degree or GED. 53% of Hispanics lack a high school diploma or GED as well. Meanwhile, only 27% of white inmates failed to graduate high school or obtain a GED.  

Interestingly, 27% of female inmates have taken some college level courses while 35% have actually graduated from college. At the state level, 46.5% of inmates lack a high school degree while 3.5% of white prisoners hold a college degree compared to 1.9% Hispanic and 1.6% black  inmates. It's worth noting too that 84% of all businesses indicate that they require a high school degree or GED to get hired. 

So, given the bleak prospects that await most individuals who "act white" face by doing poorly in school, why would they not try to do well?  I found a good answer to that question in the video below. The video, which lasts just 14 minutes, is hosted by popular content producer and social media "influencer", Amala Ekpunobi.

Born in 2000, the "unapologetic" Ms. Ekpunobi (born Susan Amala Ekpunobiis) is a former left wing student activist who has since become quite the conservative (with some strong libertarian tendencies I should add) social media star. She is also affiliated with  PragerU, a private conservative foundation and advocacy group, as a "PragerU Ambassador".  She is also a outspoken Trump supporter.  

Ironically, back in her leftist days, she considered herself as strongly "anti-white" while claiming that whites were inheritably "racist", which makes her video all that more interesting. Appearing with her in this video is another black female social media influencer and "YouTuber" who goes by the moniker of "Gothix" (real name "Vanessa"). She also appears on Instagram and Twitter (aka "X").

Born in 1988, the married podcaster is known for her conservative and Christian content, which has put "Gothix" at odds with many of her racial and social contemporaries, which adds to the impact this video has produced. Below is the video. I hope you'll enjoy it and find it as enlightening as I did in light of the data provided above.     


Video: A Response to "You Act White" w/Gothix

Amala Ekpunobi: Unapologetic


If you enjoyed the article, please consider passing it along to others and don't forget to subscribe. It's free! Lastly please be sure to "like" us on whatever platform you use to read anotheropinionblog.com. It helps with the algorithms and keeps our articles in circulation. Thank you!  


Video: The Betrayal by the Black Elite

The Real News Network: Hosted by Chris Hedges w/ Dr. Cornel West


The Two Faces of Racism


The State of America's Education System: How Low Can You Go?


Crime, Race and Ethnicity in the United States: Where Are WeHeaded?


Racism, Youth, and Distortions  by the "Woke" Left


NCES: Status Dropout Rates


Zoukis Consulting Group: Inmate Educational Levels


Friday, April 21, 2023

Crime, Race and Ethnicity in the United States: Where Are We Headed?

Since the beginning of 2023 there has been 15 mass shootings. As of April 10th, there has been 11,500 deaths due to gun violence and dozens of acts of mass violence ranging from the "takeover" of streets and intersections to the swarming and looting of local businesses.  In many cases, the police are simply outnumbered and outgunned. Meanwhile, police officers are either quitting or taking early retirement in droves, leaving cities severely shorthanded.

 As of March 7, 2023, there have been 63 police officers shot in the line of duty.That's up by 33% from 2021. Of those shot, 8 were killed by gunfire. 323 were shot in 2022. Also since the beginning of 2023, there have been 18 ambush-style attacks on police officers. Many were by individuals who had committed by a "bait" crime and waited not just for police officers to show up, but EMS or firefighters to arrive on the scene. There ambush-style attacks have resulted in 21 officers being shot, of which 3 were fatal. In 2022 there were 124 such attacks. The majority of these attacks occurred in Texas, Arizona, California, and Georgia.

According to a October 2022 Pew Research Report, 61% of registered voters said that violent crime was serious issue. 73% of Republicans said the violent crime was serious which needed to be address by Congress.  On the other side of the aisle, just 49% of Democrats saw violent crime as a serious issue. 34% of liberals in general considered violent crime was an issue which needed to be addressed by Congress. Bearing that mind, when we look at violent crime and race, we see an different picture.

According to the Pew survey, 81% of blacks, the majority of whom vote Democrat, saw violent crime as an issue which needs to be immediately addressed while 65% of Hispanics, who also tend to vote Democrat, also saw violent crime as a serious issue. Among whites, 56% also agreed. It's worth noting that just 33% of white Democrats agree with their fellow Hispanic and black Democrats.

On a related note, according to the most recent statistics regarding "hate crime" compiled by the FBI, since 2021 indicated that were 7,074 incidents of a hate crime reported. Of those, the majority---64.8%---were based on race or ethnicity. 15.6% were due to sexual orientation, and 13.3% were the result of the victim's religion.  3.6% were based on gender identity, 1.7% on disability, and 1% was solely on gender.

The report also indicted that 66.7% of the attacks were against individuals while 30% was on property and 3.3% of the attacks were generic. Just over 32% of the attacks were in or near the victim's home or place of work. 16.9% took place on a road, highway, street, sidewalk or alley. 8.1% happened at a school or on a college campus.

7% occurred in a parking lot or garage while 2.8% of the reported hate crimes were at restaurant or diner. 2.7%  took place in a park or public outdoor setting. Finally, 26.1% of the reported hate crimes happened at multiple locations.

When we look at the offenders, the FBI reported that 56.1% were white. 21.3% were black and 13.5% were unknown. When it came to the ethnicity of the offender rather than race, 7.6% were Hispanic or Latino. 8.9% were of multiple ethnicities, while the largest segment---28.1%---were simply unknown. Lastly 82.3% of the offenders were 18 years of age or older.

Using data from the 2021 FBI Uniform Crime Report, the Feds pointed out that while blacks make up just 13% of the U.S. population, they make up 33% of those arrested for non-fatal crimes which include robbery, aggravated assault, rape, and robbery. For more serious non-fatal violent crimes in which violence was used, they made up 36% of those arrested.

Hispanics comprise 18% of the U.S. population and yet are 21% of those arrested for serious non-fatal violent crimes. Whites make of 60% of the overall population and represent 46% of those arrested for non-fatal violent crimes and 39% of the more serious non-fatal violent crimes.  They also are perpetrators of 52% of the violent crimes. Victims were able to identify the race of their assailant in 85% of the cases.

When it came to multiple assailants, the average number of attackers were two, in which 43% of the assailants were black, 38% were white, and 16% were Hispanic. When there was a single attacker, 59% were white compared to 22% who were black and 14% who were Hispanic. As for Asians, they consistently had the lowest percentages of any group with an average of about 5% of crimes committed, which is in proportion to their 5.7% of the U.S. population. 

As most of you already know, the United States has the dubious honor of having the highest percentage of individuals behind bars of any industrialized nation with an average of 505 individuals per 100,000. However, among countries in general, the U.S. is sixth.

El Salvador is ranked first with 605 individuals per 100,000 behind bars. This followed by Rwanda with 580 per 100,000, Turkmenistan with 576, American Samoa with 538, and Cuba with 510. After the U.S., we have Panama's 478 per 100,000. By comparison, Turkey's infamous prison system has 374 while Russia has "only" 304 and Costa Rica, with 301, is among the lowest in the world.

When we examine the latest available information (2021) regarding the prison composition of U.S. prisons, the Prison Policy Initiative reports that the largest racial segment behind bars are blacks. As stated above, blacks make up roughly 13% of the total U.S. population. However, according to the report they comprise 38% of the total number of inmates.

The arrest rate of blacks compared to whites is 6,109 to 2,795 per 100,000 while the conviction and incarceration rate is an astonishing 2,306 to 450 per 100,000. They also make up 30% of those on parole. Hispanics are 30.2% of the prison population. Whites make up the majority of the inmate population with 57.5%. Asians are 1.4% of those behind bars while Native Americans make up 2.6%.

In terms of age, the largest segment are those between ages 36 and 40 at 17.7% of all inmates. This is followed closely by those ages 31 to 35 with 16.9% and those 41 to 45 at 16.7% of the prison population. Next in line are those between 46 and 50 who make up 11.8% of those behind bars. Ages 26 through 30 comprise 11.7% of those incarcerated.

When it comes to the crime, almost half of all federal prisoners---44.7%---got busted on drug charges. Weapons, arson, and explosives charges make up 21.7%. This is followed with 12% charged for sexual offense. Next are those busted on immigration violations. They make up 5.2% of inmates.

Extortion, bribery, and fraud make up 4.3%. Murder and other non-sexual violent crimes comprise 3.2% of federal inmates. 4.8% of inmates were convicted of burglary, larceny, and property offences charges. Robbery is 2.7% of prison population. The balance is made up of those serving time for wide range of charges such as bank robbery, embezzlement, criminal enterprises, and insurance fraud.

The majority of those sentenced to federal prison are slated to do 5 to 10 years (25.5%). 22.6% are sentenced to 10 to 15 years. Those incarcerated for 15 years but less that life make up 15.1%. Those doing up to 20 years make up 12.6% of the inmates. 9.8% are doing 1 to 3 years behind bars with 2.2% doing less than 2 years. Lifers make 2.5% of prisoners.

When it comes to gender, while women are 51% of the total U.S. population, they are only 6.8% of those serving time in a federal prison. Males are by far the largest group, making up 93.2%. The federal prison system doesn't keep track of those who identify of  a gender different from their birth certificate.

So, what does all this mean? The media, as well as those on the Far Left, claim that the majority of people shot and killed by police are those of color, and therefore, call for the total disarming of everyone.  In truth, whites are more likely than any other racial group of being shot by law enforcement.

In 2022 there was 1,097 individuals killed by the police. Of those, 225 were black while 125 were Hispanic. 22 were classified as "other", meaning Asian, Native American, or mixed race. 329 of those killed were white while the race of 321 were unrecorded or undetermined.  We have similar racial numbers going back to 2017. The only number of any real significance  is that the number of those shot and killed by police have continued to increase, from 981 in 2017 to 1097 as noted above.  

Using the FBI's most recent report of crimes committed by race and ethnicity, the "2019 Crime in the United States", there were over 6.8 million crimes committed in 2019. Of those, whites committed 69.4% of all crimes. However, the report also indicates that minorities, particularly blacks, were more likely than not to be stopped and ultimately arrested for a violent crime.  Is that due to institutional racism and "profiling"?

Not according to the report. It stated that blacks were responsible for 55.9% of all murders while whites made up 41.1%. The reminder were categorized as of "unknown" race/ethnicity. In looking at the victims, the report stated that 54.7% were black. Whites made up 32.3% and the victim's race of 3.1% of was undetermined or not listed.

When it came to violent assaults, non-Hispanic whites were likely to be the victim in half of the reported cases that didn't include a weapon. Black and Hispanic victims accounted to the majority of non-fatal firearm injuries.

Concerning robberies, whites victims and black offenders were 12 times more likely than not according to a National Crime Victimization Survey conducted in 2002. When it came to carjacking, blacks were the victim 56% of the time, followed by 21% of whites. Asians and Native Americans were carjacked 16% of the time.

It's worth noting that a 2009 Pew Hispanic Center report mentioned that Hispanics accounted for 40% of all sentenced federal offenders, while is triple their share of the population. Of this, 48% related to immigration issues, 37% for drug violations, and 15% for other crimes.

The 2019 FBI report added that while black youths made up 16% of the under 18 population, they were responsible for 52% of violent juvenile crime. Could this be a symptom of growing up in a single parent household? Perhaps. 64% of black juveniles live in a single parent household compared to 24% of white children and 15% of Asians. 40% of Hispanic kids also fell into this category.

Hispanic juveniles also made up 46.2% of all gang activity. Blacks comprised 35.3% while whites made up just 11.5%. 7% were of other or mixed racial groups. As indicated earlier, the reports stated that larger cities, suburban areas, as well as some smaller cities and towns were where the majority of these gangs were found.

The take away here is that all racial groups are affected by the rise in violent crime, but not equally. Whites are more likely than other groups to commit a crime, most being non-violent, in terms of raw numbers, but this owing to the size of the white population.  Blacks are overrepresented by percentage of population when it comes to offenders. They are also 3 times more likely to be arrested than not. However, blacks are also more likely than not to be the victim, especially if the offender is also black.

Hispanics, especially under the age of 18, are more likely than not to belong to gang. That's particularly so if they're male, come from a single parent home, and live in a urban environment. Next would be black youth (again applying the same criteria), followed by whites and Asians.

However, none of the data indicated that taking guns out of the hands of law abiding citizens would do little to reduce crime, especially violent crimes, but it would likely lead to an increase in potential victims. There's nothing criminals like better than easy pickings.

While tighter restrictions pertaining to gun ownership may slow the sale of certain types of guns, most offenders---85.8%--- acknowledged that they acquired their weapon either from a family member, friend, or the weapon had been stolen at the time it was acquired according to the U.S. Sentencing Commission. In addition, 95.6% of those arrested are given the recommended minimum sentence for the use of a firearm in carrying out a crime.

It should be noted that according to the DOJ, 79.1% of all weapons used in carrying out a crime were handguns. Rifles (including semiautomatics like the AR-15) comprised just 11.1%. Of those stolen, 20.5% were .38 caliber revolvers followed by .22 and .357 caliber revolvers  11.7% and 11.6% of the time respectively. 9mm semiautomatic handguns such as a Glock were next with 8%.

Instead of taking guns away from law abiding citizens, the emphasis needs to be on better gun security to reduce their access by criminals and out of the hands of children as well as mandatory firearms training to reduce accidental shootings.

Schools need to adopt better discipline standards in the classroom as well as implement additional programs for pre and after school activities. Curriculums need to include developing critical thinking skills and civics.  Adding community based volunteer programs would also help.

The Justice System needs to reevaluate how it treats juveniles arrested for crimes including shoplifting or bullying. Instead of slapping them on the wrist and letting the go, juveniles need to bear responsibility for their actions. There needs to be expanded rehabilitation programs for non-violent first offenders and tax credits for potential employers. In addition to more and better trained law enforcement,  there needs to be a regular presence in not just high crime areas, but in schools and government housing.

There needs to be an emphasis on keeping adult male parents in the household of their children. However, in the absence of a proper male role model, there needs to be more community based programs aimed at high risk children such as Big Brother/Sister programs. More job based programs also need to be introduced, including trade schools.

The approach we've been using since the 1970's obviously doesn't work anymore, if indeed it ever really worked. Only by instilling a sense of responsibility in youth of all races and ethnicity, better discipline in schools, and providing access to opportunities can we ever hope to reduce the current trend in violent crimes and produce more productive adults.  


If you want to know more about this article's topic, please check out the links below. If you enjoyed the article, please consider passing it along to others and don't forget to subscribe. It's free! Lastly please be sure to "like" us on whatever platform you use to read anotheropinionblog.com. It helps with the algorithms and keeps our articles in circulation. Thank you! 


FBI 2021 Hate Crime Statistics


U.S. DOJ Statistics on Race and Ethnicity of Violent CrimePerpetrators


Countries with the largest number of prisoners per 100,000of the national population as of January 2023


Prison Policy Initiative: Race and Ethnicity


Federal Bureau of Prisons: Inmate Age


Federal Bureau of Prisons: Inmate Statistics


Number of people shot to death by the police in the UnitedStates from 2017 to 2023 by race


Race and crime in the United States


DOJ: Guns Used in Crimes


National Institute of Justice: Preventing Crime: What Works, What Doesn't, What's Promising


Friday, December 23, 2022

America's State of Freedom: How Do We Compare?

There has been much discussion recently about the decline and pending fall of the American Empire, but how much of that is actually true? Is the United States as we know it tittering on collapse? Well, let's take a look at some of the studies, surveys, and polls to see where the U.S. currently stands on a number of key issues.

First up is freedom. After all, that's what we're known for ---"land of the free and home of the brave" right? According to the independent and non-partisan World Population Review, the top ten freest countries in the world are Switzerland, New Zealand, Denmark, Estonia (yes, the former Soviet Republic), Ireland, Finland, Canada, Australia, Sweden, and Luxembourg.  Wait. What? No United States in the top ten?  Nope.

Actually America comes in 15th place, just behind the UK and ahead of Japan and Germany. Also ahead of us are Iceland, Norway, and the Netherlands. The ten least freest countries are all in the Middle East and Africa (with the exception of Venezuela). Some include Egypt, Somalia, Iran and Iraq (naturally),Yemen, and the Sudan. 

Americans are known for their rugged individualism. It's the staple of practically every Western movie and TV show ever made.  Individualism, and with it our rights to personal freedom are at the core of what it means to be an American. So would it surprise you to know that the U.S. isn't in the top ten (again)? It's not even in the top 20 when it comes to personal freedom.

The United States has become a neo-fascist Corporatocracy. It's run (or managed if you prefer) by a relatively small clique of uber wealthy oligarchs (sometimes referred to a kleptocrats). These corporations and individuals have done their best to gradually impinge on our individual freedoms under the guise of "national security" (creating a surveillance state) and giving "personhood" to corporations.

So, the fact that we aren't in the top 20 shouldn't come as any surprise to you.  The countries with the greatest amount of personal freedom are all the "socialist"  Scandinavian countries as well as Japan, Australia, Ireland, Canada, Taiwan, Latvia and the Czech Republic (both former Soviet satellites),  the UK and others.

When it comes to personal freedom, the United States ranked an embarrassing 24th in the world. We are just behind Italy and ahead of Uruguay and Spain.  In terms of economic freedom, we did much better, which you'd expect with us being an Corporatocracy and all.  However, we're still not in the top five.

The top four most economically free are the Pacific nations of Taiwan, Hong Kong, Singapore, and New Zealand. Switzerland rounds out the top five. Coming in sixth place is the former Soviet republic of Georgia with the U.S. in the seventh spot. Ireland, Lithuania (another former Soviet state), and Australia rounding out the top ten. It's worth noting that most of the countries which ranked high in personal freedom ranked in the bottom half of the top 20 freest economic countries.

In looking at a report by the conservative Heritage Foundation for 2022, it's worth noting that the top economically freest countries are Singapore, Switzerland, Ireland, New Zealand, Luxembourg, Taiwan, and Estonia. The Netherlands, Finland, and Demark finish the top ten. 

The United States comes in 25th place between the UK and Georgia in the lower half of the "Mostly Free" column. We also became a debtor nation in 1985. An early warning? Germany was 16th and South Korea was 19th. The Ukraine was 130th while Russia was 113th. Both are in the "Least Free" section.

As an aside, America is also listed as a "flawed democracy". I've mentioned that this and other independent media sites are often "shadow blocked", so it should be no surprise that Reporters Without Borders should rank freedom of the press in the United States as barely satisfactory. In fact, the U.S. is ranked 43rd in the world. There are actually some third world nations ranked higher the U.S.!

Education has been called the "road to success" (or as John Wayne once said, "life is hard. It's harder if you're stupid). Either way, I have to agree. Education not only provides the individual with the keys to success, it also largely determines the success of a nation.

America has long struggled academically when compared to the rest of the world although we tend to spend more private and tax dollars on education than any other country. According to a 2021 academic report, the United States had the best overall educational system in the world followed the UK, Germany, Canada, France, Switzerland, Japan, Australia, Sweden, and the Netherlands.

When it comes to science and math, we ranked near the bottom of the second tier of developed nations. In the latest 2018 test of OECD (Organization for Economic Cooperation and Development),  we scored 478, which was below the average score of 489. The top five highest scoring countries were all Asian (Singapore, Macao, Hong Kong, Taiwan, and Japan).

In science, we did a little better, scoring just above the OECD average of 489 with a 502, but was well below the top five countries of Singapore (551), Macao (544), Estonia (544), Japan (529), and Finland (522).  In literacy, we ranked at about average with Denmark coming in first.

Another indicator of our decline is healthcare. You would think that with the resources that the United States has our healthcare would be second to none. Sadly, the U.S. has one of the worst healthcare systems of any industrial nation. While the world's overall life expectancy has continued to rise (it was 82 years old in 2020), it was 77 years of age in the U.S..

Meanwhile, mortality rates in the America have remained higher than in other OECD nations despite a general decline overall due to improved technology and medicine. The mortality rate in the U.S. dropped from 1980 to 2020 by 19% while for other industrial nations the drop was 43%.   

Early or premature deaths due to diseases and disabilities were also higher in the U.S. than elsewhere. In fact, they were roughly 37% higher. In 2019 (the latest record) non-age related deaths due to disease or disability were 26,061 per 100,000. The global average was 18,987. 

The United States also had the highest infant mortality rates of any OECD country as well with just under 24 deaths per 100,000 live births. The next closest country was Canada with 8.4 per 100,000. The Netherlands and Australia had the lowest with 1.2 and 2.0 respectively. The world average was 4.5.

Where we did well was with heart attack and stroke treatment. Using 2018 data for individuals age 45 or older over the first 30 days following the event, the mortality rate per 100 in the U.S. was 4.9 compared to 5.9 among industrial nation.. For strokes it was 4.1 versus 6.4, and for hemorrhagic (bleeding) strokes the mortality  was 19.4 as opposed to 20.7 globally.

But when it came to asthma, COPD, congestive heart failure, and diabetes we had mixed results. In measuring mortality rates per 100,000, the U.S. had 37.1 deaths related to asthma compared to an average among industrialized nations of 34.7. For diabetes, the U.S. had 226 versus 137.5.

However, with COPD we had 194.1 with 228 among comparative nations. When it came to congestive heart failure, the average among industrialized nations was 272.3. The U.S. had an appalling 411.7. There are 2018 figures, which are the latest measurements.

Finally, the United States ranks last when it comes to access to medical care and quality compared to other industrialized nations with the Netherlands, Australia, Sweden, Japan, and Austria in the top five spots.  It should also be noted that the U.S. places far less attention on preventative care and alternative medicinal treatment. There are fewer beds available in hospitals than in other OECD nations.

The United States also has among the highest prescription costs of most any nation in the world, which is attributable to its poor medical care coverage. The majority of nations have some form of nationalized (or "socialized" medicine if you prefer), resulting in lower costs and faster recovery but occasionally longer waiting times for non-life threatening treatment.

One component to having a long and healthy life is having a high overall quality of life. So how does the U.S. rank? As has been the trend for many years now, those "socialist" nations of Scandinavia have not just a better education system, better health care and higher life expectancy, they also have the highest quality of life, but they're not the only ones!

Sweden ranked number one, followed by Denmark, Canada, Switzerland, Norway, Finland, Germany, Netherlands, Australia, and New Zealand.  Other top nations include Ireland (#16), Japan (#14), and the UK (#12). As for the United States, we came in at #21, just behind Italy and Portugal but ahead of Poland and Singapore. By comparison, China and the United Arab Emirates are #24 and #25 respectively.

It's no secret that the U.S. has highest percentage of its population behind bars than any industrialized nation with an average of 625 individuals per 100,000, or to put it another way, with the U.S. having roughly 5% of the world's population, we have 25% of it behind bars. The states with the highest percentage incarcerated are Louisiana and Oklahoma. 90% of those behind bars are men.   

Following the United States is China, Brazil, India, Russia, and Thailand with the most number of people in jail (China and India dwarf the U.S. in terms of population). Israel and Bahrain have the least number of people behind bars. When examining the highest rates of incarceration based population, the U.S. again is number one followed by Rwanda, Turkmenistan, El Salvador, and Cuba.

In terms of voter approval, of the top 11 foundational institutions which support the federal government, only the military and small businesses have positive numbers. Congress consistently polls terrible. The disapproval rate for Congress is currently hovering around 77%.  In other countries their numbers would be concern for a revolt or revolution. In fact, 43% of Americans believe a civil war or revolution will occur within the next ten years.  

President Joe Biden has a disapproval rate of 51.4% while his Vice President, Kamala Harris, has a disapproval rating of 48.7%. The approval rating for former President Donald Trump is 55.7%, which seems to prove that persistent negative campaigning (aka "character assassination) works.

Meanwhile, only 30% of Americans approve of the direction the country is going in.  74% of Americans are sick and tired of bi-partisan bickering and finger pointing, including 78% of Independents, 82% of Democrats, and 68% of Republicans.  The average American has a consumer debt of nearly $100,000 while corporate CEOs earn approximately 324 times more than an average employee.  In 2020, the average corporate CEO made $670 dollars for every dollar an average employee earned.

As an aside, both corporate owned parties---Democrat and Republican---are losing more voters than gaining. Independents remain the largest political bloc and continues to grow while the Democrats and GOP battle over a shrinking piece of the political pie. Americans in large numbers disapprove of corporate lobbyists writing legislation, partisan gerrymandering, partisan offices, Citizens United while supporting citizen ballot initiatives, term limits, voter approval for tax, fee, and rate increases.

A country, no matter how large or developed, can't sustain numbers like these indefinitely, and yet that's exactly what Congress, the Presidency and Big Business expect. We continue to bolster corporations with taxpayer money and cut taxes for the rich while Americans struggle to make ends meet. In terms of poverty levels among OECD nations, America is third behind Costa Rica and Hungary.  

It's clear that the ruling Oligarchy will do nothing that impinges upon their growing control on power beyond smoke and mirrors. When citizens see no hope for real and meaningful change; when their propaganda or bread and circuses no long work, what then?  


If you want to know more about this article's topic, please check out the links below. If you enjoyed the article, please consider passing it along to others and don't forget to subscribe. It's free! Lastly please be sure to "like" us on whatever platform you use to read anotheropinionblog.com. It helps with the algorithms and keeps our articles in circulation. Thank you! 


World Population Review: Freest Countries 2022


2022 Index of Economic Freedom


Press Freedom Index


U.S. Education Rankings Are Falling Behind the Rest of theWorld


How does the quality of the U.S. health system compare toother countries?


U.S. Healthcare System Ranks Last Among 11 High IncomeCountries


Incarceration rates by country


Quality of Life


FiveThirtyEight: Polls


Congressional Approval Rating


Americans are sick of lawmakers bickering. They don't have much hope that will change


Wage gap between CEOs and US workers jumped 670-to-1 lastyear, study says


Poverty rates in OECD countries as of 2019


Friday, August 26, 2022

In America We No Longer Trust?


Our currency says "In God We Trust", but what about America? Do we still have confidence in our country? Americans, it seems, do have a serious trust issue, especially when it comes to the government and authority figures. That distrust is part of the American character stemming from those who first settled and explored this land. Many were viewed as being social, political, and religious outcasts.

The economics and social structure of the Pre-19th Century hamstrung the lower class merchants, craftsmen and subsistence farmer who toiled away on land they rarely owned while idle rich reaped the profits through rents and taxes. The social system often locked them into their social class of their birth with little or no hope of rising above it. Life for the majority was a grueling battle just to survive while the ruling elite were all but oblivious to their plight. To the elites, it was all due to "divine" ordination.

This "New World" offered a chance to change that. It was a risk, often requiring them to sell their selves into servitude for as much as a 1/3 of their anticipated lifespan just for this one rare opportunity to step up on the next rung of the social ladder. In the Jamestown of the early 1600's, approximately 75% of the population was indentured.

Upwards to 50% would die before ever seeing their freedom due to disease, exhaustion, or being undernourished.  Even for those who survived to reach the end of their servitude, many would find the land they received for their decades of bondage was infertile land or too small to sustain them. But they came anyway.

America was settled primarily by social, religious, and economic outcasts who built a new life of their own. No lords. No masters. It's helped create the image of the "rugged individual" and sense of independence which we still value to this day (and something others in foreign countries struggle to understand).  

Our alleged "insolence" and "rebelliousness" as England's King George III referred to us was even written into the Declaration of Independence while our belief in the dignity of the individual was expressed in the Bill of Rights.  So, it's no wonder that we distrust authority, which is borne out by a recent Pew Poll.

As an aside, this poll is not about "approval ratings" which often fluctuates weekly based on a variety of issues like the popularity of a party, legislation, or person as presented by the establishment media. Instead, this poll examined our "trust" or "confidence" in government, which more long term.  It also delved a bit deeper to look at other national institutions.   

Polling about the government has long been interesting, if for nothing else than from a perverse perspective to see just how low it will go. Americans have long disliked and distrusted Congress no matter which party is in control, and for the matter, the presidency. However, we have still held the Supreme Court in (relatively) high esteem, but all that's changed and we'll explain how. 

 According to the poll results, taken in July 2022, the amount of "trust" or "confidence" we had  for Congress in 2021 was a meager 12%. But as of July that figure had dropped to a pathetic 7%! As for the presidency (not the President), that "trust factor" dropped from 38% in 2021 to just 23% in 2022. When it came to the U.S. Supreme Court, they were not so "supreme".

Historically, the Supreme Court has been the one branch of government which somehow managed to sidestep the wrath of the public. Perhaps it's because it's rarely in the news or deals with issues many of us have only a passing interest in. Besides, there's always been some kind of mystique about the highest court. It's members, appointed for life, were seen as close to infallible as we mere mortals could get. They were each highly qualified for their position. The court, as a whole, was also seen as being impartial and above or outside the slimy dealings of politics.

However, the Pew Poll showed something different. In 2022, the confidence factor of Supreme Court was only 25%, which was down 11% from the 2021 results of 36%, which was still shocking. What would cause the results typically associated with Congress (on a good day) or the President? One key factor was Citizens United, a ruling that has had devastating consequences for the average American.

Citizens United, which was upheld by the Supreme Court in 2010, all but removed ordinary voters from politics and gave it to Big Business. Corporations were now seen as having the same rights as the average person, with one major exception (more on that shortly). Corporations are a legal construct. They are soulless artificial legal entities. They do not speak or act for their employees (it's often also pointed out that corporations are not democratic. They act as feudalistic kingdoms). 

Corporations function based on the collective voice of their board of directors with limited input from their shareholders. They exist solely to make a profit for those invested in its performance. Thanks to Citizens United, corporations now give virtually unlimited amounts of money to whomever they want, essentially buying the officeholder or political party.

The Supreme Court (and certain members of Congress) justify this by saying that "money equates with free speech" (of course, you and I are limited by the amount of "free speech" we donate by both legislation and practicality). That's the major exception I alluded to earlier. Even unions, which act more on behalf of the corporations they're suppose to protect workers from than the workers, can't compete. Unions are only able to donate one dollar for every ten corporations donate.

Citizens United was the final screw in creating the "Frankenstein" which transformed our Constitutional Republic into a neo-fascist Corporatocracy; our representative democracy is now run by a corporate like board of directors; an oligarchy of unbelievably rich individuals on behalf of equally rich shareholders. 12 years later and still 75% of Americans regardless of party oppose Citizens United.

The court's recent decision reversing Roe v. Wade also deeply affected the public's trust. 62% of American surveyed said the court made the wrong decision, adding that abortion should be legal in every state.

Related to the Supreme Court is the criminal justice system. As many know, we have the highest percentage of individuals behind bars, 0.7%, than any other country on the planet, be they "democratic" or authoritarian (including monarchies). That's nearly 700 individuals per 100,000. That's more than France, Russia, China, Turkey, Mexico, or Brazil. Not surprisingly, confidence in the criminal justice system is just 14%, down from 20% in 2021.

When it comes to other institutions which comprise the foundation of our nation, they've done just as poorly. In fact, 11 of the 16 institutions mentioned in the survey had declined between 2021 and 2022, and of those remaining five, their trust factor remained the same. Let's look at business first.

"Big Business" which includes companies like Walmart, General Electric, and Kroger have a current trust factor of 14% thus far in 2022%. which is down from 18% in 2021.  Large technology companies, such as Google and Apple, went from 26% to 23%. Banks and other financial companies "to big to fail" dropped from 33% to 27%.

Meanwhile, small business (or what's left of them post Covid-19), remained strong 68%, having fallen just 2% from 2021 until now. It seems we still prefer the "mom and pop" businesses that reflect our appreciation of the individual and entrepreneur, as well as the everyday familiarity which comes from the smaller local businesses and the knowledge that we are also helping our community by buying local.

Organized labor was one of the very few groups included in the survey which didn't show a decline, however, it didn't increase either. In fact, trust in unions remained at a 28% low. It's likely due to the low number of workers represented by unions as well as the corrupt reputations many unions suffer from because of the actions of a few.

The medical system took a hit from the Covid pandemic, "mandatory" vaccinations, masks, and the prolonged quarantines which hurt small businesses (which were forced to close) while helping big corporations (which were allowed to remain open). Unanswered questions regarding the vaccinates and the seemly endless "boosters" didn't do them any favors either. 

Many people nowadays question whether doctors, pharmacies, and hospitals serve the interests of insurance companies and medical research companies over the health of their patients. This lack of confidence is reflected in the poll  with just 38% trusting the medical industry compared to 44% in 2021 (we can even link the technology companies mentioned above back into this too).

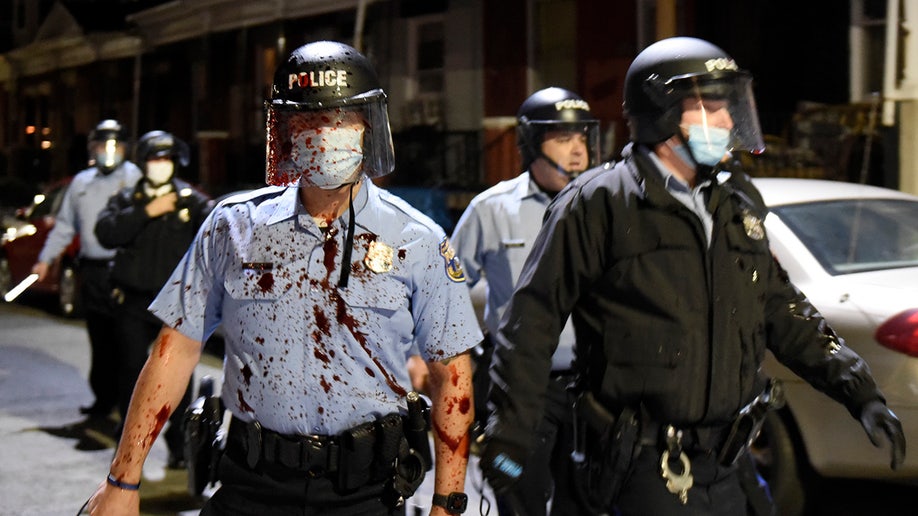
While the Covid crisis was raging, so was more civil violence resulting from the recent deaths of individuals at the hands of the police. Whether the police were at fault is a matter of opinion, but it certainly affected the public's confidence in law enforcement.

The poll backed that up by showing a decline from 51% in 2021 to 45% in 2022; a 6% drop. Along with the loss in confidence, police departments across the country are losing  law enforcement officers as hundreds continue to retire or resign each month as we reported earlier.  

Trust in the military was another one of the very few which, while dropping slightly, still remained strong with 64%. In 2022, that number had been 68%. No doubt the chaotic withdrawal from Afghanistan after 20 years of fighting and perception of a second military defeat played a big factor in 4% decline. Still, we cherish our men and women in uniform.

Turning from the military to religion, organized religion continues to decline as we reported in our last article. Overall, trust in religion is 31%, which represents a 6% drop from the previous year. While there are several factors, certainly some must include the Vatican's continuing refusal to deal with its pedophilic priests  (a issue which has spilled over to other religions), not to mention corrupt televangelists, along with issues concerning  married priests, ordaining women, birth control and abortion, gays in the church, and the centuries old conflict with science. 

Not surprising is the fact that even our school system isn't safe. Confidence in our schools and even our teachers have been on the decline for decades, starting with forced bussing and the decline of discipline in the schools in the 1970's.

Schools are now largely thought of as either public babysitters or pre-incarceration centers. Schools were once seen as safe havens, but not anymore. Respect for teachers have dropped, as has the desire to learn (for some minorities, academic achievement is often seen as "acting white" and typically results in being bullied and/or ostracized).

Today, the emphasis is on appeasement, especially if it has a racial or sexual orientation slant to it. They "graduate" individuals who can't read at grade level, can barely write, have little or no knowledge of literature, English grammar, science, or history and no appreciation of the arts.

They don't understand civics or what it means to be a citizen or to have respect for others. They have no critical thinking skills, but they sure know their sports!  They're taught that college and debt is their only option rather than the trades which are more in demand, cheaper and quicker to obtain, and pay better than average. Is it any wonder confidence in the school system is just 28%, down from 32% the year before?

Last on our list is the mainstream media. 96% of all media, including videos, movies, TV and radio programming, newspapers, books, and magazines, and even internet content are owned by just five companies. They literally control what we see and hear. They influence what we think on every topic. Most Americans nowadays no longer trust the media, which is labeled as "fake news". I find no surprise that television news has a trust factor of only 11% while newspapers (and print media) is a just 16%.  

It's not uncommon for the approval rating of this or that individual or group (such as Congress) to be in the dumpster, depending on the popularity of their party, their personality, or how they're portrayed by the media, but this poll goes further than that. It's a snapshot of our confidence in the very foundations of our society. It's also a warning.

If you want to know more, please take a look at the links below. If you enjoyed the article, please consider passing it along to others and don't forget to subscribe. It's free! Lastly please be sure to "like" us on whatever platform you use to read A/O. It helps with the algorithms and keeps our articles in circulation. Thank you! 


Confidence in U.S. Institutions Down; Average at New Low


Mass Incarceration: The Whole Pie 2022


Majority of Public Disapproves of Supreme Court's Decision to Overturn Roe v. Wade


Millions of Small Businesses Closed in 2020: The LongRecovery Ahead


The pandemic may have caused 200,000 business closures---fewer than expected