Showing posts with label Blacks. Show all posts

Friday, October 03, 2025

An Eye For An Eye: Is It Time To Do Away With the Death Penalty?

The death penalty is one of the top most hotly debated topics in America. It’s discussed in law school, seminary, medical school as apart of medical ethics. It was discussed in my jurisprudence and philosophy classes while pursuing my undergraduate degree. The validity of the death penalty is just as likely to be discussed in a bar among friends as it is at home. 64% of Americans support it while 80% acknowledge a risk of executing someone innocent and 63% say that it doesn’t deter serious crimes.

Republicans and conservatives are more likely to support the death penalty than Democrats and liberals/progressives. 62% of those claiming a religious affiliation also support it, especially Protestants (66%) and among 75% of White evangelicals. 57% of Black Protestants favor the death penalty even thought the majority of those on death row are Black. 58% of Catholics also favor the death penalty, including 61% of Catholic Hispanics.

Oddly, almost more Atheists oppose the death penalty as Protestants who favor it (65% vs 66%). 57% of agnostics oppose the death penalty while those who affiliate with no religious faith at all are more apt to support it than oppose it by 63% to 37%.

Before we get into a discussion about the death penalty, I want to make it clear that I’m not an attorney, nor am I offering any legal advice. What follows is my personal opinions based on well-established sources and data which are linked below. Some of the information may vary by state. If you’re seeking legal advice, I recommend seeking out a licensed lawyer.

When it comes to the death penalty, as of 2025, it’s on the books of 55 countries. 144 others have abolished it (the latest of which being Sierra Leone and Kazakhstan).  Among those nations which still use death penalty are China, Iran, Egypt, Japan, Saudi Arabia, and South Korea, though rare. In fact, a prisoner in South Korea is more likely to die from old age or illness. As of 2021, there were 60 individuals on their death row. Iran regularly executes gays and trans, women who refuse forced marriages, those attempting to educate women, and anyone else opposed to their brand of Shira law. 

In the United States, 23 states have done away with it, with Virginia being the most recent state to do so. Texas holds the dubious distinction of having carried out the most executions, 523, followed by Oklahoma with 116. It’s worth nothing the Virginia was third with 113. Still, that means that 27 states still use the death penalty, in addition to the federal government, which still uses it under certain circumstances.

It also bears mentioning that the United States has the highest incarceration of any nation in the world with a rate of 629 per 100,000 individuals or roughly about two million men and women behind bars. That’s more than Russia (which has suspended its death penalty), China, or Iran. Of those two million, 2,463 are currently on death row.

42% of those on death row are White, which is proportional with the overall prison population. 40% are Black and about 15% are Hispanics. Asians make up just 1.8%. Their average is about 54 years old. Most have been waiting for the sentence to be carried out for between 19 and 24 years.  The number one reason to land on death row? Premediated murder involving aggravated circumstances such as kidnapping, rape, or the use of a firearm.

Since 1976, there have been five forms of capital punishment carried out. The majority are done by lethal injection with a great deal of care taken to ensure that the injection is as painless as possible and every step is taken to ensure the prisoner’s anxiety is kept to a minimum (such as the use of valium, nitrous oxide, numbing solution at the injection site, dimming the lights, and blocking the injection itself from view).

The electric chair (once billed as being the most “humane”) is still used in some states, along with the gas chamber. Kentucky, Oklahoma, Florida, Arkansas, Alabama, South Carolina, and Tennessee are among those state which carry out executions. Gas is still used in seven states. Among them are Wyoming, Missouri, Arizona, and Alabama.  Nitrogen gas is the most commonly used although Alabama and Louisiana have opted for nitrogen hypoxia as an alternative to lethal injection.

Hanging and a firing squad are (surprisingly) still used in executions. As of 2018, only New Hampshire still allows hanging. Note that while New Hampshire did away with capital punishment in 2009, those on death row at the time were excluded. Washington State abolished hanging as recently as 2018.

As for the firing squad, Utah has used it most often. The last time was 2010. However, the firing squad is on the books in South Carolina, Oklahoma, and Mississippi. The victim is typically hooded and strapped to a chair. The shooters, approximately three to five,  are given rifles which randomly carry live or blank rounds so no one knows whether they fired the fatal shot and are positioned between 15 and 20 feet away. Their identity is protected, with the shooters firing from behind a wall or curtain. The bullets are specially designed to fragment and cause maximum injury (duh). 

It bears mentioning that there has been historically around 166 individuals executed in the United States whose, subsequent deaths to their death, have proven to have been innocent. So, it is still worth it? The alternative is life in prison and thus forcing the public to provide for their upkeep, including medical care, which can be in the tens of thousands of dollars (if not more in some circumstances).

In case you’re wondering, for someone to be sentenced to death, they must first be convicted of an especially heinous crime, which usually involves the planning and intentional murder of someone. Quite often, there are secondary crimes, often just as horrendous, involved.

The individual must be convicted unanimously by a jury. The usual criteria is that their guilt must be “beyond all reasonable doubt”. That is, there can be absolutely no question that they are guilty of the crime(s) for which they are charged. If, on the other hand, they are found guilty but based only on the preponderance of the evidence (meaning the insufficient weight of the evidence, leaving the possibility of some doubt) or if the verdict is not unanimous, the death penalty is no longer an option.  

In addition, the death penalty must also be on the table, that is, the option was made available to them by the presiding judge. Lastly, the judge must also agree with the jury’s decision. In many jurisdictions, an appeal or review is automatically granted to insure that the defendant’s rights were properly and adequately protected.  Otherwise, the defendant’s attorney will typically file upon the request of their client.

 While primarily an administrative procedure,  this is often when we hear of “new evidence” or witnesses suddenly coming to light for some reason. If it’s compelling enough to have a direct impact the case, a new trial could be granted or reexamining proposed sentencing and potentially modified (generally speaking, the sentence may only be reduced downward).  

Nevertheless, the defendant is still afforded another bite at the proverbial “I’m innocent” apple. In fact, they have virtually unlimited bites at the apple, and all at the taxpayer’s expense, which brings us to the first issue. Should someone convicted of a crime and sentenced to death, be afforded an unlimited number of appeals? Some are emphatically say “no”. They believe that an individual should have a set number of appeals or at least a cut off date (although new evidence can be introduced by their attorney at any time).

 What do you think? Should someone on death row be capped in the number of appeals they can file, at least on the taxpayer’s dime? Some argue that they’re simply trying to delay the inevitable (which is likely quite true. Who wouldn’t? After all, even the most hardcore criminal isn’t in any hurry to die). But, how long or for how much of our tax dollars should you and I be on the hook for? You would think that after the, let's say, tenth failed attempt it’s unlikely anything is going to change. But then, we’re also talking about a human life here (even though they've allegedly already deprived someone else of theirs).

There have been some pretty convincing arguments about the use of certain drugs like Sodium Pentothal, Sodium Amytal, or Scopolamine (so-called “truth serums”) which suppresses the nervous system and reduces one’s inhibitions which encourages them to talk more openly without filters. Should these be employed? 

These drugs could be used under the supervision and direction of a license psychologist. Naturally, their attorney would be present along with the prosecuting attorney and other witnesses with very specific questions. The session would obviously be recorded for future reference. What could go wrong?

Well, in theory, this would benefit all parties concerned, especially those who insist they’re innocent despite a preponderance of evidence against them for instance.  It would allow both sides to question the defendant about the crime and perhaps helps the police to redirect their investigation while allowing the District Attorney to focus their attention elsewhere.

Ideally, the DA could offer one of the drugs in exchange for a reduced sentence, a dropping the possibility of a death sentence, or even a dismissal of the charges. At that time the defendant can alter their previous statement before proceeding. But, if it is revealed that they were lying, there’s no going back. They can’t suddenly decide afterwards to come clean or try and make a deal. It’s a one time offer only. Maybe the threat (or promise) of a truth serum would be incentive enough to get to bottom of what they know. 

However, the main problem is that while under the influence of one of these “truth serums”, an individual becomes highly susceptible to suggestion, false memories, and unless new actionable details are revealed, their statements are difficult to verify. Nevertheless, it would seem that if you’re truly innocent, it would be worth the risk as well as time and would save a lot of time.  

 In addition, the U.S. Supreme Court ruled in 1963 (“Townsend vs. Satin”) that the use of truth serums were unconstitutional since they could be used to self-incriminate, despite that fact that the CIA, the nation’s top spy agency, made use of these (and other) types of drugs through, at least the 1970’s. I wouldn’t doubt that thanks to the Patriot Act and FISA courts, they aren’t still used in one form or another.

Given the current selection of execution methods being used, which many call unethical and inhumane, what if there was another choice made available? What if the defendant was offered a deal like this---they agree to five or some other fixed number of taxpayer based appeals and no more. It would save huge amounts of taxpayer money and reduce wasted court time (courts are already highly congested). 

Then, in exchange for dropping the possibility of lethal injection, the gas chamber, or “Old Sparky” and the long wait on death row, they agree to a life sentence in isolation with no further contact with anyone except their lawyer, the prison doctor and a single guard to check up on them and bring them their meals, etc. However, there can be no conversations. Unlike being in the "hole" where the prisoner is thrown into small cell with no light or anything else, the prisoner would be permitted books, TV, magazines, and receive some limited outside time (again, in isolation) but nothing else.  

It sounds cruel, and I suppose in some ways, it is. As far as society would be concerned, they’re dead as if the execution had been carried out. It wouldn't prevent others from attempting to find evidence on their behalf.  The chief downside is that some would consider it to be  “cruel and unusual”, but then if they’re  willingly agreed to, is it? Currently, the average inmate spends just shy of 20 years on death row awaiting their sentence to be carried out. Talk about the “Sword of Damocles” hanging over your head!

Also unlike the "hole", the prisoner can opt out at any time and agree to an execution within 24 hours. Another variation on this idea would be to execute prisoners on death row within five or so years of their convictions absent any new evidence.  As it is, many die of old age or some illness while waiting to be executed. How fair is that, especially the prisoner?  To me, lingering for 20+ years would be “cruel and unusual” punishment.

Finally, the alternative would be do away with the death penalty altogether. After all, we are the only nation in the Americas still using the death penalty and one of the very few major industrial nations to use it. What if their sentences are converted to life in solitary confinement as suggested above or would it be better that they just spend their life in prison without any restrictions while we continue to pick up the tab?

It should be noted that studies have shown that sentencing someone to death is significantly more expensive than being sentenced to life. In Maryland, a single death sentence case can costs as much as $3 million dollars. In Texas, a death sentence case can be as much as three times that of a life sentence, and so on. What do you think? Should we, in the 21st Century, still be using a death penalty? Do you think it’s fair or just?

Finally, just as a reminder, although I do have around 25 years of legal experience as the senior legal manager for a receivables firm, I am not an attorney and I’m certainly not offering legal advice. I’m just providing my opinion based on existing data and history. However, there’s no question that our legal system needs serious reforming, and there’s no better place to start than with death row. The lost of 166 innocent lives in 166 lives too many.

  Thank you for reading "Another Opinion", the Op/Ed blog page for the "militant middle".  Here at "A/O" we truly value our readers. At A/O we seek the facts as they exist, not partisan talking points.  We hope you find our articles informative and engaging. Comments are welcome, provided they are not vulgar, insulting or demeaning.  Another Opinion is offered without charge and is directed toward all independent and free-thinking individuals. We ask, however, that you "like" us on whatever platform you found us on in order to keep our articles available for free to others. Lastly, in order to keep costs down, we depend on passive marketing, and therefore, depend on our readers to please forward our posts along. Below you will find links to the sources we used in writing this article. Thank you. 


Death Row Overview


Hanging Legal States 2025


Execution by firing squad


Death Penalty Cost


Kentucky Government: Notes on the Costs of Death Penalty


Death Penalty Information Center: Costs


Pew Research: 10 facts about the death penalty in the U.S.


Friday, August 15, 2025

Examining Racial and Ethnic Reality Part 1: Introduction, Home and Hearth, and Education


Growing up in the United States in the 1960’s and 1970's, we were often told that “polite society” doesn’t publicly discuss religious, political, or sexual preferences.  Race was another such topic. Today, things have changed and it seems that everything is on the table.  There are those who seem to expect some sort of positive reinforcement for wearing their political, religious, racial, or sexual allegiance on their sleeve.

They feel entitled to an obligatory pat on the back, a celebratory ice cream cone, or handout, and when that reward isn’t forthcoming, they become offended, indignant, or defensive. They become upset that their life choices or fluke of genetics aren’t being rewarded or as impressive as they think they should be to others. 

You’re expected to embrace their world view or face being ostracized (aka “cancelled”), shouted down, physically attacked, or worse yet, being called a name and incredibly, they become indignant when they are the ones called out.  Race and ethnicity are such topics, and ones which warrant critical examination.  

Introduction

For example, when we examine race, we find something similar in the reaction. Individuals, almost two centuries removed, want not just sympathy for what some ancestor may or may not have endured, but they want to be compensated for what they never experienced. Those who look beyond color and (to quote Dr. Martin Luther King), judge people by the “content of their character” are often considered the worst offenders.

They behave as if this was a one off historical phenomena. Just one group--- white Europeans---were somehow solely responsible for the institution of slavery, forgetting that the most prolific dealers of human flesh weren’t Europeans, but the Arabs of Northern Africa (who put a premium on white flesh).

They give no thought to the historical fact that forced servitude has existed since Mankind existed. Every people and every race has at one time or another been slave and master. It’s a chain we all wear. They have also conveniently ignored the fact that it was these same white Europeans who all but put an end to this hateful institution or that they implemented legislation and taxpayer supported programs balance the scale that has existed since we roamed the African savannahs.

Equally, they’ve chosen to disavow the historical fact that it was their brethren who betrayed them and sold them into slavery, which sadly still continues to this day in Africa as well as parts of Asia. Perhaps the ancestors of the person on the street they randomly call “brother” or “sister” may been responsible for the plight of their ancestor, only to have later been caught up in the net? Such twists of fate aren’t as uncommon as one might think. It’s well documented that blacks owned black slaves in the U.S. or that native Americans had slaves of all races.

Nevertheless, for some reason, they “demand” to be compensated for what they aren’t entitled to (and arguably have already been given). They “demand” that the people who freed their distant ancestors from bondage must also assume some form of self-imposed “guilt” for doing so. Why is that? Is this anger at the people who delivered them from slavery justified or is it anger at themselves for not taking the initiative to free themselves and their refusal to place the blame where it truly belongs?

Shouldn’t their anger be more accurately directed to those who ensured their bondage in the first place, or is that just a little too close to home? If there is some sort of guilt to be had, perhaps it should be their failure to take responsibility for their own future, trading a “master” on a plantation for a politician or bureaucrat? What of the millions of immigrants who’ve come here from a different culture and customs, not speaking the language, and with next to nothing in their pockets, but have adapted very quickly?

They took advantage of the opportunities available, and as a people, kept their independence, and succeeded while the so-called “freed” people who’ve had the advantage of time, language and integration remain in a state of self-imposed bondage, blaming others for their poverty, broken homes, crime, high unemployment, alcoholism and drug abuse. If it was systematic, there should be few or no exceptions, but there are many.

In their anger at themselves, they lash out at others, such as in Cincinnati a few weeks ago, violently attacking individuals who were of no threat to them or looting the businesses of immigrants who’ve succeeded. Is this self-loathing, reversed racialism, opportunism or a combination? Let’s set aside emotions, pre-conceived ideas, and bias in order to examine the data and see what it can tell us.

Home and Hearth

According to the U.S Census Bureau, Whites have 50.5% of all live births while Blacks have 13.9%. Asians and Pacific Islanders are responsible for 6.2%. Native Americans have 0.7% of all live births, and Hispanics make up 25%. Nevertheless, the overall percentage of White and Black fertility rates have been in decline over the past several decades as has Native Americans.

 However, Hispanics, Asians, and Pacific Islanders on the other hand have seen their fertility rates increase, meaning that Asian and Hispanic populations are growing relatively faster than that of whites and blacks. By 2050, the U.S. is expected to reach a near racial parity with no dominate race. How that will work out remains a guess but often cited as a key factor for an eventual (and likely) balkanization of the United States.

A key factor in predicting the eventual success of a child is whether or not they are born in a dual or single parent homes. According to the Center for Equal Opportunity, Black Americans have the highest rate of illegitimate children. According to the Center, nearly 70% of Black children---69.3%-- are born out of wedlock. Compare that to 41.6% of Hispanics and 21.9% of Whites. It’s 59.3% for Native Americans. For Asians of Chinese origin, that number is 6.4% while Japanese Americans it’s 9.7%.

Two interesting asides worth mentioning are these. 45% of Black professionals (including managers) have had at least one illegitimate child compared to just 3% of White professionals.73% of Black high school students admit to having sex. That compares to 52% of Hispanic students and 44% of White students. Also, Black adults have the highest divorce rates while Asians have the lowest. Native Americans have the second highest and Hispanics have the second lowest.

When it comes to preschool care, Hispanic children are most likely to receive home centered care from a parent.  Black children are most likely to receive some form of home based care from a non-parent relative (like grandparent, aunt, uncle, etc.). White kids are most likely to receive home based care from a non-parent or relative such as a nanny or babysitter. Children of mixed race were most likely to receive preschool care from some sort of center (such as a daycare). When it came to subsidized care, Hispanic and black children were most often the beneficiaries.

The National Library of Medicine reported that Black infants tended to have lower birth weights than other groups. They also reported than less than 1/3 of children living at or under the national poverty rate took advantage of programs such as Head Start, and while Head Start tends to provide higher quality care than other centers, Black children receive poorer quality care compared to children of other races. The reasons cited were the birth weight (including high nutritional foods, as well a poor educational levels Black as well as Hispanic ethnicity, especially in family care centers.

 Interestingly, a 2013 study by the Centers for Disease and Prevention reported that 70% of Black fathers who live with their kids were active in their lives compared to 60% of Whites and 45% of Hispanics. 78% of Black fathers tended to have dinner with their children every day while 74% of White fathers and 64% of Hispanic fathers did. Additionally, 27% of Black fathers took their children to and from activities. By contrast, just 20% of White fathers did.  When it came to the all important homework and childcare, 41% of Black fathers stepped up. Meanwhile, only 29% of Hispanic fathers and 28% of White fathers helped out.  

Education

When it comes to graduation, Asian and White students have the highest rates with Asians leading the way. Among Asians and Pacific Islanders, the graduation rate is 94%. For Whites it’s 90%. Hispanic graduation rates are 83% while for Black students it’s 81% and 74% for Native Americans.  

Some additional statistics along the same lines that I found was that 68% of Asians have a bachelor’s degree or higher. That compares to just 25% of Hispanics and 44% of Whites.  On the other side of spectrum, just 4% of Asian had less than a high school diploma. Only 5% of Blacks didn’t have a high school degree along just 7% of whites. However, just over 20% of Hispanics lacked a high school diploma.

It bears mentioning the Black females graduate at a higher percentage than Black males. 64.1% go on to college and graduate. Of those, 71.5% earn a master’s degree, and out of those, an impressive 65.9% obtain a doctorate although more Black males  overall have a doctorate or professional degrees such as a law  or medical degree. It bears mentioning that Black female students face a unique hurdle their counterparts don’t.

For those that tend to be “overachievers”, they are often harassed or treated as social outcasts for their academic performance, often being accused as “acting White”, coming most often from their Black male peers. There have been instances reported where Black students have asked that they not be singled out publicly for some achievement or award to avoid being bullied.

 Some actively try to downplay their academic performance, and even join in with the “bad crowd” in order to blend in. Some have reported being coerced into skipping assignments or school, drinking, drugs, violence, crime, and sex in order no to stand out. The result is that they usually end up holding the proverbial  “bag” and sidetracking their lives.

Finally, it bears mentioning that there are 180 “Black Only” academic scholarships and over 25 “Hispanic Only” scholarships and about 12 scholarship programs directed toward Asian-Americans. Native Americans can apply for approximately 150 “Native American Only” scholarships plus individual tribal scholarships. As for Whites, there are none. The reason, it's argued, is that Whites aren't a minority (the U.S. Census Bureau would disagree. White males are in fact a minority). 

Nevertheless, as the counter argument runs, scholarships should not be based on racial or other quotas, but rather on financial need based on their social-economic situation. It’s also worth noting that prior to 2023, ranked racial quotas were used by many colleges and universities in order to increase  on campus “diversity”, even bypassing higher qualified candidates.

In part two of our look at race, we'll take a look at employment and unemployment, Affirmative Action and quotas, racial equality in politics, crime  and prison sentencing. Finally, we’ll address the issues of reparations, the future of race relations, and what does all this mean, if anything?

Thank you for reading "Another Opinion", the Op/Ed blog page for the "militant middle".  Here at "A/O" we truly value our readers. At A/O we seek the facts as they exist, not partisan talking points.  We hope you find our articles informative and engaging. Comments are welcome, provided they are not vulgar, insulting or demeaning.  Another Opinion is offered without charge and is directed toward all independent and free-thinking individuals. We ask, however, that you "like" us on whatever platform you found us on in order to keep our articles available for free to others. Lastly, in order to keep costs down, we depend on passive marketing, and therefore, depend on our readers to please forward our posts along. Below you will find links to the sources we used in writing this article. Thank you. 


Trans-Saharan slave trade


Barbary slave trade


Barbary Pirates and English Slaves


Percentage of Births to Unmarried Women


Study: Black dads more involved in activities with theirchildren than other groups


Quality Disparities in Child Care for At-Risk Children:Comparing Head Start and Non-Head Start Settings


Fast Facts: Women of Color in Higher Ed


Race and Intelligence


First Divorce Rate by Age and Race/Ethnicity  


Thursday, February 20, 2025

The National Divorce: Trust in the Government

When Donald Trump was first elected President, his campaign mantra was “make America great again”. Now that he’s back, it’s once again the mantra of his followers, but did you know the phrase didn’t originate with “The Donald”? It was actually first used by President Ronald Reagan in his 1980 presidential campaign. It was also included in his acceptance speech at the 1980 Republican National Convention.

The expression seemed to catch on and was later adopted by President Bill Clinton during his 1992 Presidential campaign, and again used in a radio commercial for Hillary Clinton during her run in the 2008 Democratic Primary. Ironically, we now hear from the Left asking, “what’s so great about America?” and “when was America ever great?”

Both Trump’s and Bill Clinton’s use of the phrase was to intentionally harken back to the popular myth of “the Gipper” who emerged from the anger and apathy of the preceding years like a candle leading the nation out of darkness.  America was still recovering from the hangover of 60's and 70's, the Watergate scandal, the defeat in Vietnam, stagflation, the OPEC oil crisis, the Iranian hostage crisis, and what was widely view as governmental incompetence.

Under President Eisenhower’s two terms, 73% of Americans said they trusted their government. Going along partisan lines, the trust level of government was 79% among Republicans. Even Democrats were happy (yes—actual “happy” Democrats. They did once exist). 71% said they trusted in the government.

The overall trust level had jumped to 77% by the time Lyndon Johnson took office. But as the war raged on and the causality rates rose (as well as lies by the military and government became public), those numbers started to drop. Still, they would be regarded as high by today’s standards with 66% confidence level by Democrats and a 60% by Republicans.  By the time Johnson left office, and Richard Nixon took over, public trust had dropped but still remained strong at an overall 68%.

Following Nixon’s resignation and the advent of Gerald Ford’s “caretaker” administration, public trust was floundering at 36%. Among Republicans, just 38% had any confidence in the government. The Democrats weren’t far off with 36%. Jimmy Carter was elected as the “anti-insider” in 1976. The American People had had enough of Washington insiders and Carter took office with a new high---40%---before falling to 28% by the time he left office.

Despite Reagan’s perceived popularity over his eight years as president, trust in the government never did any better than 46%, a pale reflection of the Eisenhower days which he often recalled in his speeches. By 1994, during the Clinton Administration, the public’s trust in the government hit a record low of 19% before rising to 49% by the end of his second term.

President Reagan was well known for his often quips. One involved his switching parties. When asked why he left the Democratic Party and joined the Republican, he famously said “I didn’t leave the Democratic Party. The Democratic Party left me”. I guess this was the time when the American People could say the same thing about both parties and the government in general. Government had left the American People. The national divorce had begun.

Sadly, it took a tragic event like 9/11 to rekindle America’s faith in their government, and it came shortly after George W. Bush (aka “Dubya”) took office. Poll numbers vary slightly, but trust in government ranged between 55% and as much as 60% according to some polls. Since then, confidence in the government by the American People has been on a downward trajectory ever since. As some have said, “we're on a roller coaster ride in a handbag to Hell and no one is driving”

The best Trump did in his first term was 27%. Under President Biden, levels of trust in the government again repeated lows of 19%. Even among Democrats, the trust factor never rose above 35%  while for Republicans, it remained at levels one could only call abyssal---11%. Today, Americans barely tolerate each other. We tend to live in our collective bubbles and regurgitate what we see and hear without bothering to question or investigate.

Even when we break down trust in government by race, we don’t see much of change. Using the Eisenhower/Kennedy/Johnson administrations as the starting point, Blacks and whites intersected in October 1964 with a 77% each having an overall government trust.

Staring in 1968, that trust among blacks plummeted. The next time it peaked was in 1993, corresponding with Clinton’s inauguration, when it hit 43%. Even under Obama, it didn’t do any better than 39% in February 2013. Biden got close in April 2021 with 37%.  Trust levels hit rock bottom in March 2019  during Trump’s administration when they dropped to 9%. 67% of blacks said they believed the political system as it exits is designed to hold them back. 

Among whites, their highest trust level in government following October 1964 wasn’t until October 2001 under George W. when it reached 61% (this was just a few weeks after the 9/11 attacked).   For whites, their low point was 8% in October 2011 under Obama.

According to this Pew poll, Hispanics weren’t tracked until December 1990 while “Dubya” was the president. Their initial start point was 39%. They quickly reached their highest level of trust of 57% in December 1998, late into Clinton’s tenure as President before rapidly dropping off. Their next high point came in January 2013 when it reached 44% under President Obama.  Interesting, their lowest level of trust in the government came near the end of Biden’s term when it hit 23%.

Lastly, Asians. Apparently, they didn’t reach ample numbers to poll until first appearing in August 2020 when they were polled with a trust level of 27%. They peaked in May 2022 at 37% under Biden and bottomed out a month later at 23%. Native Americans and Independents weren't included in the poll.

Now, President Trump promises to make us “great” once more. That would mean taking us politically, socially, and economically back to the       post World War II years of Harry Truman and Ike. The American economy was booming and we had taken center stage as empires of old, England, France, and Germany faded from the limelight. We had become a “superpower”.

Barely a month into office and Trump has already begun implementing many of campaign promises (a rarity in itself). He has started deporting illegal residents by the thousands (many of whom had previously just laughed at the usual empty rhetoric about deportation). He has started purging the government of useless and redundant bureaucrats, saving taxpayers millions in the process, and having an eye towards shutting down unneeded agencies. President Trump is, as promised, “draining the swamp”.

Of course, in his zeal, he needs to be careful of not overreaching into areas vital to ordinary citizens such as Social Security, unemployment, or WIC, while ensuring that those who actually need government services receive it. Often reformist zeal can turn into blind zealotry. 

Politics is a delicate balancing act between achieving results, which isn't popular with the vested interest, but necessary to the public at large, and being "Mister or Mistress Popularity". However, trust in the government is something altogether different. It’s based the public’s confidence in the government’s ability to get things done fairly and honestly irrespective of any other factor.

 For too long, the bulk of American citizens have seen government as inept and corrupt. Over 65% of Americans are unhappy with our position in the world. 72% of America agree with the statement that "America was once a good example of democracy, but no longer".  Among the OECD nations, the United States ranks near the bottom when it comes to trust in government at 31%. Only Columbia and Chile rank lower. Switzerland ranks the highest with 83.78%. 

We’ve watched the government slide from a Republic responsible to its citizens to a neo-fascist corporatocracy which serves Wall Street. Much of what President Trump has done so far bears that out. The question is, or will shortly become, “what now?” How do we keep the Status Quo in check? Can we root our the "Deep State"? How will other nations, especially the rising BRICS nations, react as the U.S. tries to reassert its global dominance?  

America has become so deeply divided between those who want to keep the size of government at a minimum…and at arm’s length…and those who want expand the “nanny” or “welfare” state. That means reform if not an all-out overhaul of government and maintaining the corporate-government status quo. Those who would seek balance---the Center---have been largely purged from both parties, yet comprise the nation's largest voting bloc as Independents. Who will prevail remains to be seen.

 Perhaps, like empires of the past, we are destined go our way separate ways. We are, as our Founding Fathers often said, a “grand experiment”. Our future was not pre-ordained. I suspect that we’ve already exceeded their expectations. One thing is for sure though. If we are to “make America great again”, we cannot continue to limp along as we have been and hope to maintain what remains of the Republic. Extremism and intolerance has no place among a free people. 


Thank you for reading "Another Opinion", the Op/Ed blog page for the "militant middle".  Here at "A/O" we truly value our readers. At A/O we seek the facts as they exist, not partisan talking points.  We hope you find our articles informative and engaging. Comments are welcome, provided they are not vulgar, insulting or demeaning.  Another Opinion is offered without charge and is directed toward all independent and free-thinking individuals. We ask, however, that you "like" us on whatever platform you found us on in order to keep our articles available for free to others. Lastly, in order to keep costs down, we depend on passive marketing, and therefore, depend on our readers to please forward our posts along. Below you will find links to the sources we used in writing this article. Thank you. 


Pew Research: Public Trust in Government: 1958 - 2024


72% of American say the US used to be a good example ofdemocracy but isn’t anymore


WEF: Trust in Government by Country 2024


Make America Great Again


The American Experiment


Gallup: A Third of Americans Satisfied With Global Position


Black Americans mistrust the US political system


Friday, October 25, 2024

Who Votes in America? A Snapshot of the Average American Voter

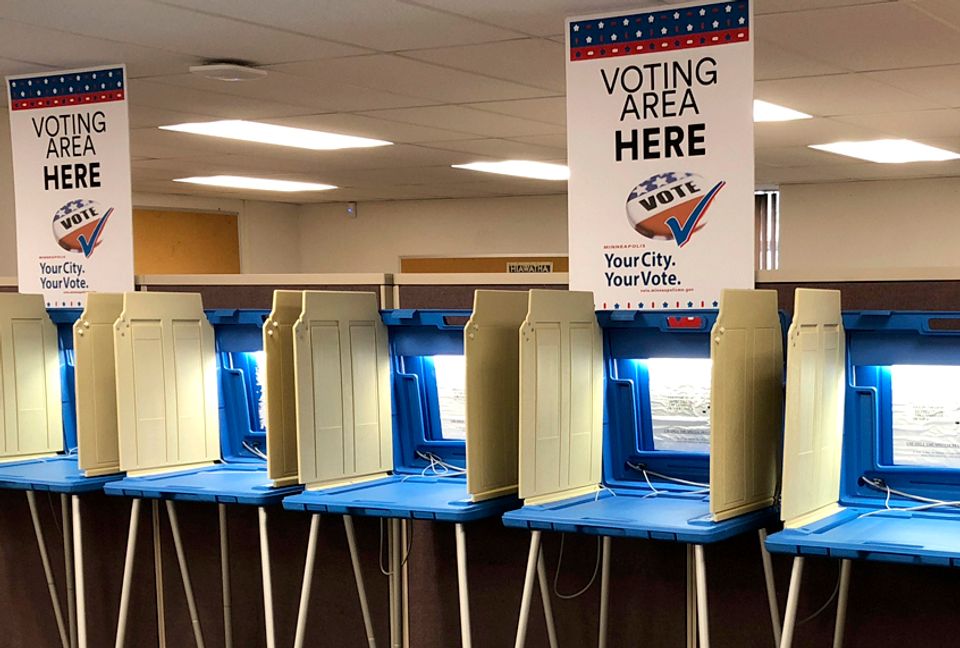
It's ironic that nearly every election is billed as the "most important" to our democracy, and yet voter turnout in the United States is among the lowest of any democracy. I remember when I first ran for a seat on our newly created Metro Council, voter turnout in my district was between 5% and 7%. You would think there would be more interest for electing representatives to a newly created local metro government council (we had just merged city and county governments), but nope!

Other democracies have a far greater percentage of voter turnout that we do (we're ranked 31st in the world). For many people it means trudging on foot for miles enduring all kinds of terrain and weather, through dangerous areas controlled by drug cartels, terrorists, corrupt police and military troops, all trying to intimidate voters. But Americans, it seems we will stay home at the drop of a hat. Any ole excuse will do. Is it that we just don't care anymore? Who does show up to vote? Let's look at the numbers.

Voter turnout in the United States in the 2020 presidential election was 66.1%. Of the eligible 240 million voters, 158,427,986 bothered to show up (and of that, an estimated 5% of the votes were cast by illegal immigrants).  Colorado, Maine, Minnesota, Wisconsin, Washington State and Oregon had the highest percentage of turnout with 75% or better of eligible voters showing up at the polls. Hawaii, Oklahoma, Tennessee, Missouri, and West Virginia had the lowest turnout---under 55%---of registered voters.

Historically, voter turnout for presidential elections has been in the neighborhood of 55%. The lowest turnout since 1932 was in 1996 when just 49% of the voting age population showed up to decide between between Bill Clinton, Bob Dole, and Ross Perot. Clinton won with 49% of the vote, Dole received 40.7% and Ross Perot got 8.4%.

As an aside, the lowest voter turnout in U.S. history was the 1792 presidential election between George Washington (seeking a second term) and John Adams.  The turnout was just 6.3% (or 28,000 voters out of a population of 3,919,023). Of course, there were only 15 states back then. Apparently being "Father of the Country" didn't count for much.

Women weren't allowed to vote until 1920, following the passage of the 19th Amendment and the hard work of suffragettes. The last state to approve the amendment was Tennessee on August 18, 1920 (incidentally, my great grandmother was one of those suffragettes. She lived in Nashville). 

The highest voter turnout at the polls was in 1876 when 82.6% of eligible voters showed up to vote for Rutherford Hayes or Samuel Tilden. This was one of the earliest elections to allow former slaves to vote following the passage of the 15th Amendment in 1870.

Although America has had a wide variety of political parties since 1790, the two main parties nowadays are the Republicans and Democrats, although there are several strong third parties which include the Libertarian Party, the Green Party, and the Constitution Party (according to a October 4, 2023 Gallup report, support for third parties is up 63%, the highest increase since 2003).

Nevertheless, both of the two major parties have been hemorrhaging voters, especially since the Supreme Court upheld the "Citizens United" ruling in 2010 which effectively gave over control of the U.S. political system to corporations by declaring they had  "personhood" and basic civil rights. It also declared money was  "free speech",  and without a cap on donations, they could give what they wanted. That meant the few would have more "free speech" than the many.  

For about the last 10 or so years, voters have shifted away from the growing extremism of either corporate owned party and becoming Independents or joining third parties. Today, registered Independents make up about 41% of all registered voters with the Democrats and Republicans comprising 28% and 31% respectively (Independents were as high as 51% in June 2024).

There are currently 244 million eligible voters in the U.S.. Of that, there are 168.31 million registered voters. As we said above, the majority of voters are registered as Independent, followed by Republican and Democrat. When it comes to gender, women tend to vote more often than men. In fact, according to the Center for American Women and Politics, there were 7.4 million more female voters in 2022 than men. To rephrase it, 68.4% of registered women voted compared to 65% of men.

According to a Pew survey, in 2020 48% of registered male voters who showed up voted Democrat compared to 55% of females. 50% of registered Republican males voted while 44% of Republican women did. In 2022, a presidential off year, 44% of male Democrats voted as did 51% of Democratic women. So, in both instances, Republican males showed up more than Democratic males. Among females, the opposite was true.  More female Democrats voted than Republicans.

The survey left out the political majority---Independents (does that subtlety imply a measure of partisanship I wonder?), which is interesting given that Independents made up over a quarter of all voters who showed up at the polls in 2020. Independents tend to lean conservative when it comes to the economy and taxes and lean liberal on most social issues. Independents are, to frame them, typically moderates. They oppose the extremism of the prevailing duopoly.

 When it comes to voting, Independents look at individual candidates and their positions on specific issues compared to their partisan counterparts who tend to vote along party lines (even if it means holding their noses to do so). For instance, in 2022 Democrats voted for Democratic candidates 96% of the time with just 3% refusing to walk in lockstep.

It wasn't any different among Republicans which had the same percentages. Independents, however, tilted more for Biden in 2020 than Trump (54% to 41%) because of the latter's perceived unpredictability and the extremism of the Republican Party. In 1994, more Independents backed President Bush than Bill Clinton by 18 points because he was a unknown factor with a questionable past.

What does this mean? In 2022, 74% of voters disapproved of how Biden was handling (or mishandling as the case may be) of the economy. Given the lockstep mentality of both parties, and their near dead heat in voter registration, it will be the Independents who may decide the 2024 election and do so into the future. The question is which, if any, of the two corporate owned parties can pull in the Independent voter? Independents are political "free agents" and the Democrats and Republicans aren't the only game anymore.

According to a CNN poll, Democratic voters between ages 18 and 29 and 30 to 39 turned out in heavy percentages---63% and 51% respectively---then the percentages drop off significantly to the mid and lower 40% range.  Among Republicans, the inverse was true. The percentages for the same age brackets were 35% and 47%. Ages 40 and older saw the numbers jump to about 55%.

Married Republicans voted 58% of time compared to 39% who are single. For Democrats, just 41% of married couples voted. But if you're single, that percentage jumps to 59%! So, in looking at these two sets of statistics provided by CNN, young single Democrats are more likely than not to show up at the polls. On the other hand, older married Republicans are most likely to be dedicated voters.

Looking backward, although the historical affiliation among the youth vote has been Democrat, it has been by decreasing margins coming forward. If Pew had included Independents, the data would have shown that the general trend among the youth in both parties are deserting the two corporate parties in droves and becoming Independent. As an aside, almost 50/50% favor some form libertarianism  or type of social democracy. Support for traditional capitalism is also in decline.

When it comes to race, 92% of Black voters voted for Democrat in 2020 compared 8% who voted Republican. In 2022, 93% voted Democrat while 5% backed the GOP. In looking at the 2020 white vote, 43% went Democrat in contrast to 55% who voted Republicans. in 2022, 41% of white voters voted Democrat while 57% went Republican.

Hispanics, who are now the second largest population in the U.S., voted 61% Democrat in 2020. 36% backed Republicans (most were of Cuban descent). Those number changed slightly in 2022 when 60% voted Democrat and 39% when Republican. Asians weren't much different. 70% voted Democrat in 2020 compared to 30% Republican. 2022 saw 68% going Democrat and 32% voting Republican.

If we look at race and gender,  60% of white males voted Republican in 2022. 38% voted Democrat. Among white females, 55% voted for the GOP in 2022 while 44% sided with the Democrats. Among Black males, 93% backed Democrats while just 6% supported the Republican Party. Black women were nearly identical with the male counterparts. 93% went Democrat and 5% back Republicans.

Among Hispanic males in 2022, 43% sided with Republicans. 56% back the Democratic Party (one reason may be for the perceived leniency toward illegal immigration and less willingness to deport compare to the Republicans). It appears that 64% of Hispanic females agree. 34% side with the Republicans. Unfortunately, there was no data for Asians.

 In the 2022 election, individuals with a high school or less level of education leaned Republican by a margin of 59% to 39%. Those with an associate degree favored the GOP by 54% to 44%. However, those with a four year degree favored Democrats to Republicans, albeit narrowly, 51% to 48%. For those with a Master's degree or better, 61% voted Democrat versus 37% went for the Republicans.

Does this mean that the more educated you are the more liberal you become or is it the longer exposure to a liberal infused education? Higher education is supposed to be about encouraging critical thinking skills and enhancing the ability to reason rationally and without bias based on facts right? But what if the "facts" are tainted?  A 2023 study showed that 26% of professors considered themselves conservative while 17% said they were moderate. But, 50% admitted they were liberal.  

When it comes to income, more lower income families are registered Democrat than Republican, and they're also more likely to vote. 58% compared to 36%. Among upper middle class voters, 52% will turn out for Republicans compared to 46% for Democrats. Meanwhile, the very wealthy actually show up for Democrats over the Republicans 53% to 46%. It appears that the average Republican voter is someone with a lower middle to upper middle class (the very class which is decreasing the rapidest).

As an aside, union members are more likely to be registered Democrat (59%) than Republican (39%) although the Democratic Party depends on corporate dollars. Among non-union voters, it's almost a even split with 48% Democrat and 49% Republican. Most renters are Democrat compared to Republican (64% to 32%) whereas most homeowners vote Republican (51%) as opposed to Democrat (45%).

When it comes to military service, 63% of veterans vote Republican while 51% of non-military tend toward the Democrats. 72% of white veterans lean Republican but 82% of Black veterans are Democrat. Similar numbers hold true for those who attend church regularly. The majority of white churchgoers---59%---tend to vote Republican while Black churchgoers vote Democrat in near equal numbers.  

So, there you have a snapshot of the average American voter. Women are more likely than men to show up at the polls to vote. The older the voter, the more likely they'll vote. Higher education doesn't equate to more conservative voting. Those with a high school (or trade school degree) are more likely to turn out to vote than someone with bachelor or higher degree.

Among race, whites and Hispanics are more likely to vote than Asians or Blacks. The excuses varied. It could range from getting away to vote, a lack of convenient transportation, no ID or simply a lack of interest. Ultimately, the missing factor appears to be a lack of motivation to show up. But regardless, the result is the same. No vote no voice no b*tching.

The voters of 2024 won't be much different from the voters of 2022, except that turnout will likely be higher. Right now the polling numbers show a virtual dead heat. Will it be who can get their side out in numbers that stands the best chance of winning? Is it who can swing the Independent vote that will win? Personally, I think Joseph Stalin had it right when he allegedly said "those who vote decide nothing. Those who count the votes decide everything", but then that's a problem we've been experiencing with greater frequency isn't it  


Thank you for reading Another Opinion! We hope you enjoyed this article and will pass it along. Please don't forget to subscribe. It's free! Lastly, please "like" us on whatever platform you use to read anotheropinionblog.com. It helps beat the algorithms and keeps our articles in circulation. Please find below the links we consulted in researching this article. 


Voting Patterns in the 2022 Elections


Voter turnout in United States presidential elections


Gallup: Party Affiliation Week of October 1, 2024


Citizens United vs. FEC


Women's Suffrage in the United States


Gender Differences in Voter Turnout


Independent Voters Have the Final, and Future, Say


Conservative Faculty are Outliers on Campus Today


Partisanship by family income, home ownership, unionmembership, and veteran status


Most White Americans who regularly attend worship servicesvoted for Trump in 2020


Turnout in U.S. has soured in recent elections but by somemeasures trails that of many other countries


Support for Third U.S. Political Party Up to 63%


Friday, June 14, 2024

Where has Patriotism Gone and Other Trends

The indomitable Mark Twain was once quoted as saying "There are three kinds of lies: lies, damned lies, and statistics" and he was absolutely right. Extracting the desired data from statistics is generally referred to a "manipulating" the data, which couldn't be a more accurate description of the process. The ideal use of statistics is to uncover what the information tells us, hidden in all those numbers and responses.

However, manipulating the data can and is often used in more deceiving ways too. It can be used to manufacture a desired outcome or create a certain impression. This is often the case in politics or the media when they try to persuade voters, legislators , or the general population to think, support, or vote a certain way.

I've long had an interest in applied (or predictive) social demographics and trends. Ever since I began working on my undergraduate degree in economics back in 1984,  my fascination with demographics, trends, percentages and interpreting them has only grown as regular readers of A/O know ad nausem!  

Recently I came across a recent study regarding patriotism and how would individuals respond to a invasion of America by some foreign power. What made the study particularly interesting is that the survey focused on registered voters belonging to one of the two corporate owned political parties, the Democrats and the Republicans along with the largest voting bloc, Independents.  

A survey conducted in March 2022 by Connecticut's Quinnipiac University asked registered Republican and Democrat voters whether they would be willing to help defend in the United States in the event of a Ukrainian style invasion. Perhaps naively, I expected the answer would be an overwhelming "yes" regardless of party affiliation. I was surprised by the results.

According to the survey, 52% of Democrats said they'd bail on the U.S. and attempt to find somewhere safe outside of the country. Just 40% said they'd stick around and fight while the rest---8%---were undecided. The survey explained that pacifists and conscientious objectors and those under 18 were excluded, so the respondents were adult males and females.

When the question was posed to registered Republicans, 68% of the respondents said they'd help defend this country. While that's a pretty decent response, it also means that around 32% would bug out. I guess conservatism or protecting our way of life only goes so far.

It's worth noting that of the nation's largest political demographic, Independents, 57% said they'd stand and fight.  As an aside, the same question was asked of active duty and reserve military personnel  and veteran households. The majority---68%---would defend America, yet surprisingly 27% would bail with the rest undecided.

The survey also broke down the respondents by gender (sorry, but only two were available to pick from), race and age brackets. 75% of men would fight (there goes that "macho" thing again) while 40% of women would remain. The age bracket indicated that those 35 years and older were the ones most likely to take up arms and defend the country. 48% of those 34  and under (which covers mainly Millennials and Gen Z) said they'd hit the road.  

Then we look at race, the poll lists only Black, White and Hispanic. Asians, Native Americans, and Pacific Islanders were evidently excluded because their percentages were too low. So, when examining  the category of race, 57% of whites and 61% of Hispanics said they were willing fight while only 38% of black Americans would remain. 35% of whites, 33% of Hispanics and a whopping 59% of blacks said they'd leave.

Here's where data results can be a little deceiving (presumably unintentional in this case). When I cross checked a Pew survey from December 2019, which was just three years before the Quinnipiac University poll, I found some conflicting results. According to Pew, as of 2017, 57% of  the combined U.S. military were white while 43% belonged a minority population.

Delving into that 43% percentage we find that Asians make up 10% of the military and another 15% belonged to a mixed or different races such as Native American. Hispanics made up 36% and are the fasting growing minority in the military. However, the largest minority---39%---serving in the Armed Forces were Black Americans.  Meanwhile, 2/3 or 68.8% percent of active duty military are classified as white.

It's worth mentioning that out of the 3,535 Medal of Honor Awards given,  94  went to black military personnel.  61 individuals of Hispanic origin have won the Medial Honor while 22 Native Americans have shared that honor. 35 Asian or Pacific Islanders have also been so honored. As an aside, out of the 3,535 Medal of Honor recipients, only 103 are still alive. Most were award for their valor during the Civil War. The second highest was in World War II followed by the "Indian Wars" and the Vietnam War.

Given the original survey question and the resulting data raises an interesting question. I wonder what would happen if China for instance would attempt an invasion. Would we react to the Chinese-Americans the way we did to Japanese-Americans during WWII?  For those unfamiliar with the history of that era, following the attack on Pearl Harbor in 1941 by Japan, the U.S. ordered the incarceration of all Japanese living in America, citizen or not. They were held in what could be at best called "concentration camps".  

Another factor that is often overlooked is that while a small percentage of the U.S. population---just 2.9%---some 19% of Native Americans and Native Alaskans ("Eskimos") serve in the U.S. military. That's a pretty significant percentage when you consider that Black-Americans make up 14% of the U.S. population and comprise 21% of active duty military personnel (they serve in the Army at a higher ratio of any racial minority based on population size).

Hispanics are the second largest population (and rapidly growing) behind whites account for just under 19% of the total U.S. population or approximately 62.1 million Hispanics or individuals of Hispanic origin in the U.S.. However, based on their population size, they are heavily underrepresented in our military, but according to survey, most Hispanics---61%---are willing to defend this country.

So, what can we glean from the above information? Well, according to the survey the majority of males who are of white or Hispanic origin, middle age or older and are either Republican  and/or conservative as well as the predominantly centrist Independents are most likely to come to America's defense should the nation need them.

The least likely are women of any race, Black Americans, and those 34 and under (which intriguingly  comprises Millennials and Gen Z. Those are the two generations replacing us aging Babyboomers and Gen Xers) and Democrats, which presumably encompasses progressives or liberals well.  

On a related note, a 2022 survey from Statista reported that 48% of Republicans/Conservatives personally own a firearm while another 66% said there is a gun in their household. 32% of Independents own a gun and 42% live in a home where there is one or more.

By contrast, only 20% of Democrats have a gun. Just 32% acknowledged one being in their home. So, taken all together,  I guess if the proverbial "SHTF" should ever occur, you know who's most likely to make a stand to protect this country, and who knows, maybe your butt too. Just saying.


If you enjoyed the article, please consider passing it along to others and don't forget to subscribe. It's free! Lastly please be sure to "like" us on whatever platform you use to read anotheropinionblog.com. It helps beat the algorithms and keeps our articles in circulation. Thank you!


Quinnipiac University Poll March 7, 2022


Pew Research: The changing profile of the U.S. military:Smaller size, more diverse, more women in leadership


USNI News: Department of Defense Demographic Profile


Latinos Claim Larger Share of U.S. Military Personnel


Black Americans In The U.S. Army


OMH: Hispanic/Latino health


United States Army: Medal of Honor Award


Statista: Percentage of population in the United Statesowning at least one gun, by political party affiliation


Friday, May 17, 2024

Breaking Up May Not Be So Hard to Do: Secession from High Crime, High Taxes, and Failing Schools is on the Rise

Remember Reverend Louis Coleman (1948 - 2008)? He was a widely known black social activist in Louisville Kentucky, noted for his megaphone and had a national following. He was sometimes referred to as Louisville's "Dr. King". or "Jesse Jackson. Others called him an extortionist or race baiter. 

Rev. Coleman would ago around organizing protects mainly along racial lines outside of businesses  with the media in toe often inspiring fear from local business (mostly white) owners. City government agencies weren't exempt either. Coleman was active from the 1970's until his death in 2008.

Most every owner (or "target" as some called themselves) would typically cave to whatever his demands were, which usually included hiring more black employees, the cleanup of predominantly black neighborhoods, investment in or relocating businesses to the West End as well as "suggestions" of making a substantial financial "donation" to some black owned program (the majority of which were aimed at remedial education and ending substance abuse). Frankly, he was a hoot to watch in action!

Not long before he died in 2008, the megaphone toting activist grew frustrated with the City of Louisville's hiring policies and especially its budget allocation. (he claimed that black areas were being short changed). Coleman demanded more taxpayer money be directed to Louisville's West End, Portland, and Newburg areas which are predominately black (blacks comprise approximately 24% of Louisville's population, Hispanics and Asian populations were nominal). Interestingly Coleman faced resistance, which was  rather unusual.

Coleman threaten to form a movement which would result in the West End leaving Louisville and becoming a self-incorporated city, taking its tax base and voters with them. (while it produced little in the way of taxes, its resident voted solid Democrat). Rather than inspiring angst and caving to his demands, Coleman and his supporters were meet with a mixture of laughs and "encouragement" to pack up and leave.

Knowing his bluff had been called, Coleman quietly backed down. There was no way the West End, even if joined by Portland and Newburg had the tax base to support itself as its own city.  Nevertheless, the idea of splitting off from a high crime city with a largely inept Board of Education, a hamstrung police department, a rubber stamp Metro Council (which replaced a rubber stamped Board of Aldermen with the City/County Pact of 2003), and a string of worthless mayors, hasn't gone away (it's worth noting that since 1969, the City of Louisville has been run by the Democrat Party).

Since the merger between the City of Louisville and Jefferson County in 2003 (and county residents got screwed), there has been widespread public and private conversations about breaking up with Louisville, which has gone from an important production hub to a city of warehouses.

Reverend Coleman's "Achilles heel" in his threat to succeed from the city was the lack of an organization and having an adequate  self-supporting tax base, hasn't been lost on anyone. It seems that the desire to leave is still there, but as of yet, not the organization or money.

In recent years, as things have continued to decline in the city (which now has murders on par or exceeding that of much larger cities like Chicago and Detroit), the lack of high end jobs or even something as basic as quality schools which are safe, the talk about a "municipal divorce" has taken on a more serious tone.

Communities in the Greater Louisville area have begun exploring a number of possibilities ranging from reversing the 2003 City-County merger to the succession of parts of the southwest portion of the county (which also most strenuously opposed the merger) such as the communities of Pleasure Ridge Park (PRP), Valley Station and Prairie Village. Residents in other parts of the county, including Hillview, are starting to explore other options outside of Louisville proper.

So, where to go? Unlike Coleman's threat of creating a separate city, residents are looking to merge with one of the adjacent counties such as  neighboring Bullitt County. The reasons are numerous, but most notably center on the fact that as a whole, Bullitt County tends to be conservative with strong traditional family values, which closely matches the values in Southwest Jefferson County.

The City of Louisville has a long history of being quite liberal, especially in neighborhoods such as the Highlands and Phoenix Hills. Bullitt County and Southwest Louisville are mostly blue collar working class. Bullitt County has a lower crime rate, better schools, a more responsive government, provides better quality services, and best of all, has lower taxes.  

I said earlier that local residents lacked organizational know how (which plagued Rev. Coleman earlier). However, that may have changed. Residents in the Baton Rouge community of St. George faced many of the same issues as those in Louisville may have found a way to break from their decaying city. I've included a link to the story below in bold, which I think you'll find interesting. It may also give county residents in Louisville  a possible roadmap for making a successful break with the city possible.

Of course, the move prompted many to start calling St. George residents the usual name calling such as "racist", "supremacists" "red lining", "segregationist" and so forth. However, the real reason for the break was a dismal school system (and the refusal to allow St. George the opportunity to create a separate school district), high crime and a  highly unresponsive local government. Sound familiar? 

The break came as a result of several years in court with the state's supreme court finally granting the resident's application to break away. The move, according to Baton Rouge's mayor, Sharon Weston Broome (D), members of Metro government, and the NAACP, the break will hurt the city due to loss of the rather wealthy tax base of St. George and result in reviving the budget. She also said they would fight the high court's "mistake" and will continue every effort to force St. George back into Baton Rouge.

St. George is not the only community to break off. Similar movements (called "soft secession") are happening in New Orleans, St Louis, Atlanta, and in other communities. In Oregon, resident of Wallowa County, lead by the "Greater Idaho Movement" are close to breaking away from Oregon and joining with Idaho. Secessionist movements exist in places like Vermont, New Hampshire, and Maine. Their are numerous communities throughout the U.S., but especially in parts of California, Florida, Texas, Arizona, and New Mexico, which appear little different from communities in Cuba and Latin America. These are also forms of soft secession since there is little or no efforts to assimilate.  

Some survivalists and individuals  wanting to live "off the grid" have grouped together to form their own communities away from society are another form of "soft succession".  There are numerous Hispanic communities throughout the U.S. which are de facto ethnic enclaves totally immersed in their culture, language,values and traditions with no intentions of ever assimilating.  

The Black Panthers and Nation of Islam have long sought to create "separate but equal" zones away from others.  You could refer to certain religious sects such as the "Branch Davidians" led David Koresh in Waco Texas a soft secessionist. You could even argue that the wealthy elite are de facto secessionist too. After all, they tend to live in their own world, tucked away in protected gated communities, with their own values and laws. 

So what are secessionist movements on the rise? For many of the same reasons cited earlier, namely quality of schools, high crime and higher taxes, a breakdown in infrastructure, along with a unresponsive government. Wallowa residents say they have nothing in common with Western Oregon, which is known for being extremely liberal.  So-called "sanctuary" states and cities are de fact forms of this soft succession in that they are defying and operating outside of federal laws for instance.

Even the wealthy members of Congress, the judicial system, and the "nomenklatura" who run the government's agencies and bureaucracy are the same. They have little in common with the people they're suppose to represent. Ordinary laws and behavior don't apply to them. Even their values are different. As author F. Scott Fitzgerald wrote in his 1926 novel, "The Rich Boy" "Let me tell you about the truly rich. They are different from you and me...They think deep in their hearts, that they are better than we are because we had to discover the compensations and refuges of life for ourselves."

Lastly, did you know too that there are 14 unique secessionist movements currently active in the U.S.?  They  range from natural or historical sovereignty, race, ethnic heritage, religion, taxes and excessive government interference or control or nationalism. Whether any of these movements will succeed is matter of both debate and time. What might not seem plausible now may be common sense later on. One thing is for sure, America is more deeply divided than at any time since 1760's in Colonial American prior to our revolution or the late Antebellum period just prior to the Civil War.

As for Louisville residents, what the residents of St. George accomplished may prove to be a useful template. The merger wasn't as billed. Residents in the county, especially in Southwest Jefferson County, have repeatedly come up short since 2003. Perhaps the time has come to step up to the plate and swing for the fence. What do you think? Is it time to split? 


If you enjoyed the article, please consider passing it along to others and don't forget to subscribe. It's free! Lastly please be sure to "like" us on whatever platform you use to read anotheropinionblog.com. It helps beat the algorithms and keeps our articles in circulation. Thank you!


Black Leaders PANIC After Whites Leave City


Report: Louisville, Jefferson County merger fails todeliver, No job growth seen for Louisville


Economic effects of Louisville merger remain uncertain 20years later


Louisville Crime Map


Reverend Louis Coleman: History Maker


Miracle on 34th Street: How Louis Coleman became our 'Dr. King' in Louisville


Wealthy white Louisiana residents win right to split fromBaton Rouge and form own city


Why Does St. Louis Continue to FAIL. 70 Years and Counting


Shocking Reasons Nobody Moves To New Orleans


Succession is here: States, cities, and the wealthy arealready withdrawing from America


Oregon break away effort is down to just 8 votes, deepeningurban - rural divide


List of Separatist Movements in North America