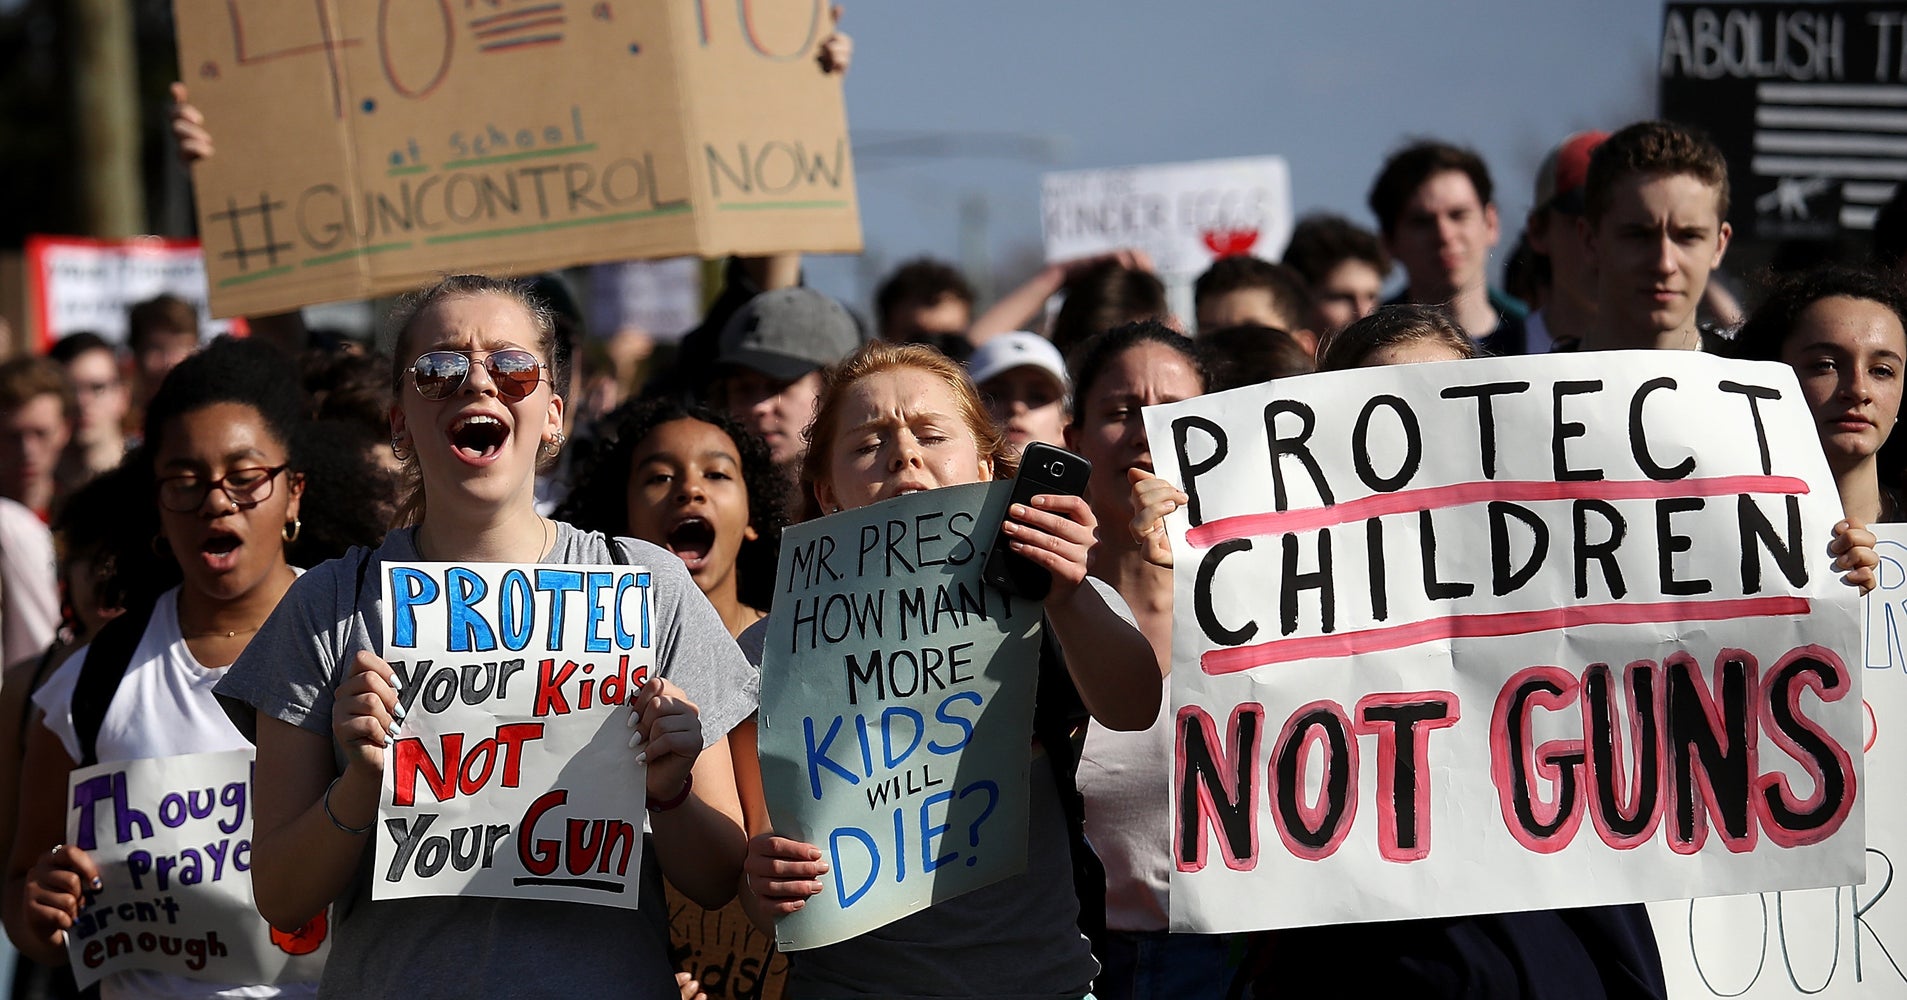
Since the beginning of 2023 there has been 15 mass
shootings. As of April 10th, there has been 11,500 deaths due to gun violence
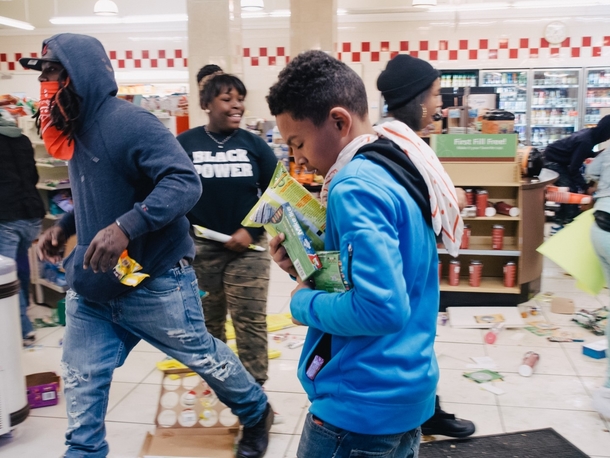
and dozens of acts of mass violence ranging from the "takeover" of
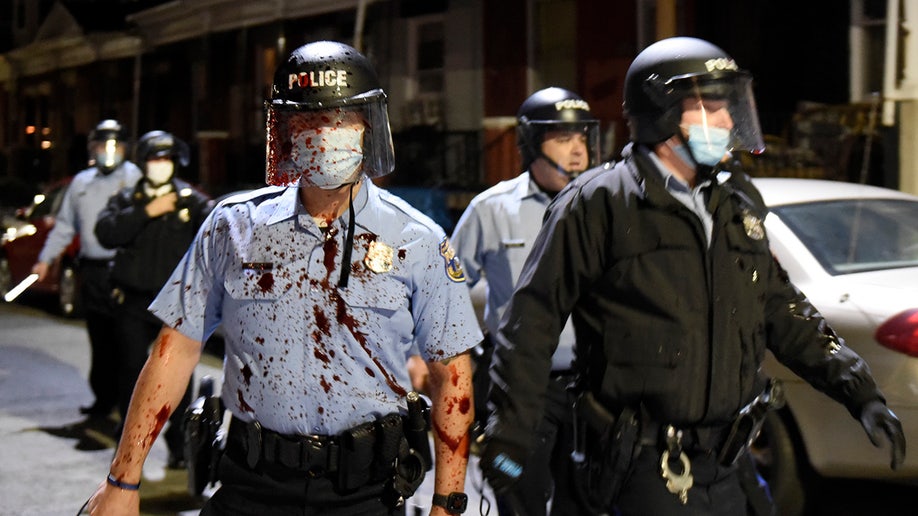
streets and intersections to the swarming and looting of local businesses. In many cases, the police are simply
outnumbered and outgunned. Meanwhile, police officers are either quitting or
taking early retirement in droves, leaving cities severely shorthanded.
As of March 7, 2023, there have been 63 police officers shot in the line of duty.That's up by 33% from 2021. Of those shot, 8 were killed by gunfire. 323 were shot in 2022. Also since the beginning of 2023, there have been 18 ambush-style attacks on police officers. Many were by individuals who had committed by a "bait" crime and waited not just for police officers to show up, but EMS or firefighters to arrive on the scene. There ambush-style attacks have resulted in 21 officers being shot, of which 3 were fatal. In 2022 there were 124 such attacks. The majority of these attacks occurred in Texas, Arizona, California, and Georgia.
According to a October 2022 Pew Research Report, 61% of
registered voters said that violent crime was serious issue. 73% of Republicans
said the violent crime was serious which needed to be address by Congress. On the other side of the aisle, just 49% of
Democrats saw violent crime as a serious issue. 34% of liberals in general
considered violent crime was an issue which needed to be addressed by Congress.
Bearing that mind, when we look at violent crime and race, we see an different
picture.
According to the Pew survey, 81% of blacks, the majority of
whom vote Democrat, saw violent crime as an issue which needs to be immediately
addressed while 65% of Hispanics, who also tend to vote Democrat, also saw
violent crime as a serious issue. Among whites, 56% also agreed. It's worth
noting that just 33% of white Democrats agree with their fellow Hispanic and
black Democrats.
On a related note, according to the most recent statistics
regarding "hate crime" compiled by the FBI, since 2021 indicated that
were 7,074 incidents of a hate crime reported. Of those, the
majority---64.8%---were based on race or ethnicity. 15.6% were due to sexual
orientation, and 13.3% were the result of the victim's religion. 3.6% were based on gender identity, 1.7% on
disability, and 1% was solely on gender.
The report also indicted that 66.7% of the attacks were
against individuals while 30% was on property and 3.3% of the attacks were
generic. Just over 32% of the attacks were in or near the victim's home or
place of work. 16.9% took place on a road, highway, street, sidewalk or alley.
8.1% happened at a school or on a college campus.
7% occurred in a parking lot or garage while 2.8% of the
reported hate crimes were at restaurant or diner. 2.7%
took place in a park or public outdoor
setting. Finally, 26.1% of the reported hate crimes happened at multiple
locations.
When we look at the offenders, the FBI reported that 56.1%
were white. 21.3% were black and 13.5% were unknown. When it came to the
ethnicity of the offender rather than race, 7.6% were Hispanic or Latino. 8.9%
were of multiple ethnicities, while the largest segment---28.1%---were simply unknown.
Lastly 82.3% of the offenders were 18 years of age or older.
Using data from the 2021 FBI Uniform Crime Report, the Feds
pointed out that while blacks make up just 13% of the U.S. population, they
make up 33% of those arrested for non-fatal crimes which include robbery,
aggravated assault, rape, and robbery. For more serious non-fatal violent
crimes in which violence was used, they made up 36% of those arrested.
Hispanics comprise 18% of the U.S. population and yet are
21% of those arrested for serious non-fatal violent crimes. Whites make of 60%
of the overall population and represent 46% of those arrested for non-fatal
violent crimes and 39% of the more serious non-fatal violent crimes. They also are perpetrators of 52% of the
violent crimes. Victims were able to identify the race of their assailant in
85% of the cases.
When it came to multiple assailants, the average number of
attackers were two, in which 43% of the assailants were black, 38% were white,
and 16% were Hispanic. When there was a single attacker, 59% were white
compared to 22% who were black and 14% who were Hispanic. As for Asians, they
consistently had the lowest percentages of any group with an average of about
5% of crimes committed, which is in proportion to their 5.7% of the U.S.
population.
As most of you already know, the United States has the
dubious honor of having the highest percentage of individuals behind bars of
any industrialized nation with an average of 505 individuals per 100,000.
However, among countries in general, the U.S. is sixth.
El Salvador is ranked first with 605 individuals per 100,000
behind bars. This followed by Rwanda with 580 per 100,000, Turkmenistan with
576, American Samoa with 538, and Cuba with 510. After the U.S., we have
Panama's 478 per 100,000. By comparison, Turkey's infamous prison system has
374 while Russia has "only" 304 and Costa Rica, with 301, is among
the lowest in the world.
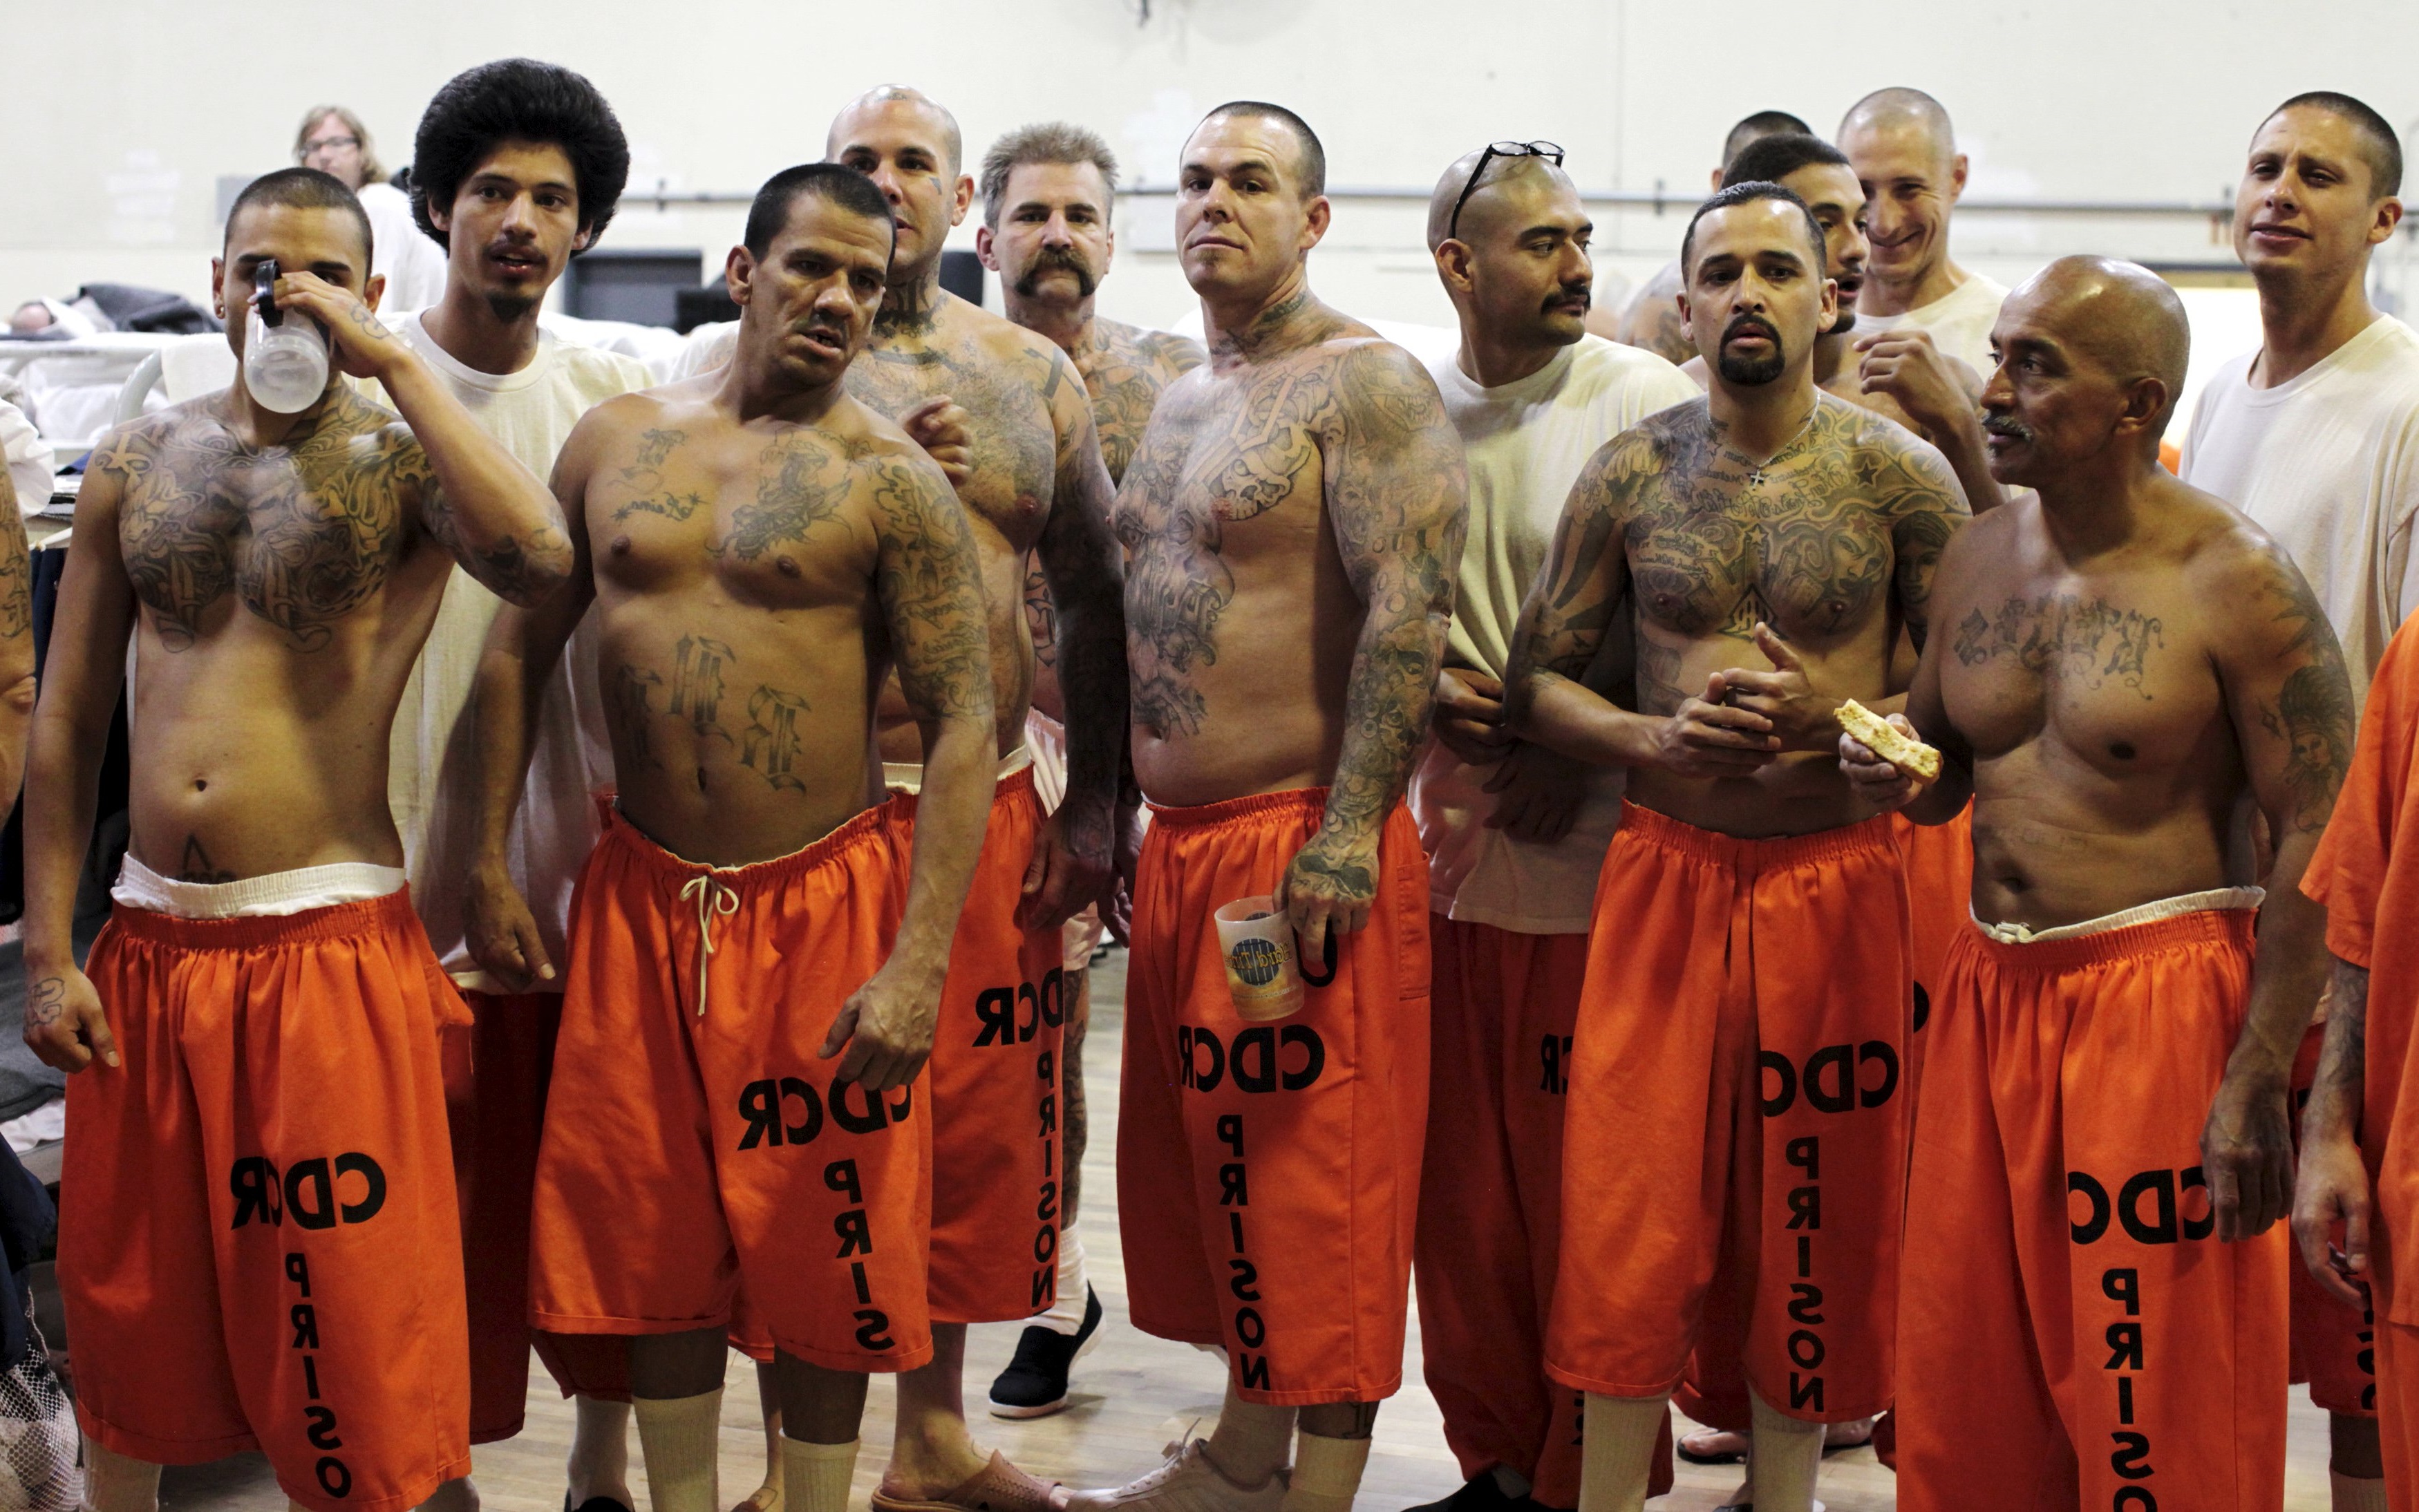
When we examine the latest available information (2021)
regarding the prison composition of U.S. prisons, the Prison Policy Initiative
reports that the largest racial segment behind bars are blacks. As stated
above, blacks make up roughly 13% of the total U.S. population. However,
according to the report they comprise 38% of the total number of inmates.
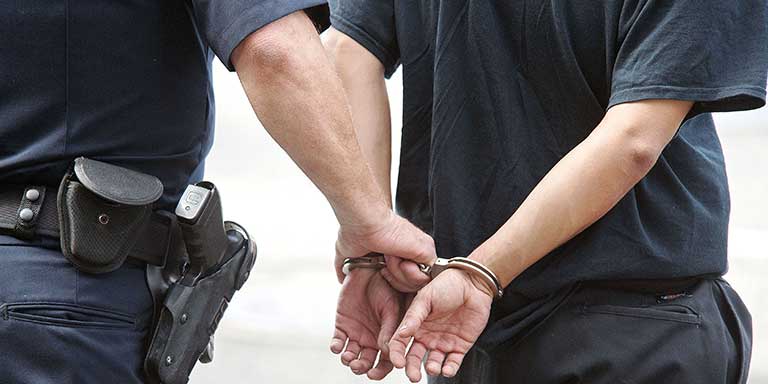
The arrest rate of blacks compared to whites is 6,109 to
2,795 per 100,000 while the conviction and incarceration rate is an astonishing
2,306 to 450 per 100,000. They also make up 30% of those on parole. Hispanics are
30.2% of the prison population. Whites make up the majority of the inmate
population with 57.5%. Asians are 1.4% of those behind bars while Native
Americans make up 2.6%.
In terms of age, the largest segment are those between ages
36 and 40 at 17.7% of all inmates. This is followed closely by those ages 31 to
35 with 16.9% and those 41 to 45 at 16.7% of the prison population. Next in
line are those between 46 and 50 who make up 11.8% of those behind bars. Ages
26 through 30 comprise 11.7% of those incarcerated.
When it comes to the crime, almost half of all federal
prisoners---44.7%---got busted on drug charges. Weapons, arson, and explosives
charges make up 21.7%. This is followed with 12% charged for sexual offense.
Next are those busted on immigration violations. They make up 5.2% of inmates.
Extortion, bribery, and fraud make up 4.3%. Murder and other
non-sexual violent crimes comprise 3.2% of federal inmates. 4.8% of inmates
were convicted of burglary, larceny, and property offences charges. Robbery is
2.7% of prison population. The balance is made up of those serving time for
wide range of charges such as bank robbery, embezzlement, criminal enterprises,
and insurance fraud.
The majority of those sentenced to federal prison are slated
to do 5 to 10 years (25.5%). 22.6% are sentenced to 10 to 15 years. Those
incarcerated for 15 years but less that life make up 15.1%. Those doing up to
20 years make up 12.6% of the inmates. 9.8% are doing 1 to 3 years behind bars
with 2.2% doing less than 2 years. Lifers make 2.5% of prisoners.
When it comes to gender, while women are 51% of the total
U.S. population, they are only 6.8% of those serving time in a federal prison.
Males are by far the largest group, making up 93.2%. The federal prison system
doesn't keep track of those who identify of
a gender different from their birth certificate.
So, what does all this mean? The media, as well as those on
the Far Left, claim that the majority of people shot and killed by police are
those of color, and therefore, call for the total disarming of everyone. In truth, whites are more likely than any
other racial group of being shot by law enforcement.
In 2022 there was 1,097 individuals killed by the police. Of
those, 225 were black while 125 were Hispanic. 22 were classified as
"other", meaning Asian, Native American, or mixed race. 329 of those
killed were white while the race of 321 were unrecorded or undetermined.
We have similar racial numbers going back to
2017. The only number of any real significance
is that the number of those shot and killed by
police have continued to increase, from 981 in 2017 to 1097 as noted above.
Using the FBI's most recent report of crimes committed by
race and ethnicity, the "2019 Crime in the United States", there were
over 6.8 million crimes committed in 2019. Of those, whites committed 69.4% of
all crimes. However, the report also indicates that minorities, particularly blacks, were more likely than not to be stopped and ultimately arrested for a violent crime. Is that due to institutional racism and "profiling"?
Not according to the report. It stated that blacks were
responsible for 55.9% of all murders while whites made up 41.1%. The reminder
were categorized as of "unknown" race/ethnicity. In looking at the
victims, the report stated that 54.7% were black. Whites made up 32.3% and the
victim's race of 3.1% of was undetermined or not listed.
When it came to violent assaults, non-Hispanic whites were
likely to be the victim in half of the reported cases that didn't include a
weapon. Black and Hispanic victims accounted to the majority of non-fatal
firearm injuries.
Concerning robberies, whites victims and black offenders
were 12 times more likely than not according to a National Crime Victimization
Survey conducted in 2002. When it came to carjacking, blacks were the victim
56% of the time, followed by 21% of whites. Asians and Native Americans were
carjacked 16% of the time.
It's worth noting that a 2009 Pew Hispanic Center report
mentioned that Hispanics accounted for 40% of all sentenced federal offenders,
while is triple their share of the population. Of this, 48% related to immigration
issues, 37% for drug violations, and 15% for other crimes.
The 2019 FBI report added that while black youths made up
16% of the under 18 population, they were responsible for 52% of violent juvenile
crime. Could this be a symptom of growing up in a single parent household? Perhaps.
64% of black juveniles live in a single parent household compared to 24% of
white children and 15% of Asians. 40% of Hispanic kids also fell into this category.
Hispanic juveniles also made up 46.2% of all gang activity.
Blacks comprised 35.3% while whites made up just 11.5%. 7% were of other or
mixed racial groups. As indicated earlier, the reports stated that larger
cities, suburban areas, as well as some smaller cities and towns were where the
majority of these gangs were found.
The take away here is that all racial groups are affected by
the rise in violent crime, but not equally. Whites are more likely than other
groups to commit a crime, most being non-violent, in terms of raw numbers, but
this owing to the size of the white population. Blacks are overrepresented by percentage of
population when it comes to offenders. They are also 3 times more likely to be
arrested than not. However, blacks are also more likely than not to be the
victim, especially if the offender is also black.
Hispanics, especially under the age of 18, are more likely
than not to belong to gang. That's particularly so if they're male, come from a
single parent home, and live in a urban environment. Next would be black youth
(again applying the same criteria), followed by whites and Asians.
However, none of the data indicated that taking guns out of
the hands of law abiding citizens would do little to reduce crime, especially
violent crimes, but it would likely lead to an increase in potential
victims. There's nothing criminals like better than easy pickings.
While tighter restrictions pertaining to gun ownership may
slow the sale of certain types of guns, most offenders---85.8%--- acknowledged
that they acquired their weapon either from a family member, friend, or the
weapon had been stolen at the time it was acquired according to the U.S.
Sentencing Commission. In addition, 95.6% of those arrested are given the
recommended minimum sentence for the use of a firearm in carrying out a crime.
It should be noted that according to the DOJ, 79.1% of all
weapons used in carrying out a crime were handguns. Rifles (including
semiautomatics like the AR-15) comprised just 11.1%. Of those stolen, 20.5%
were .38 caliber revolvers followed by .22 and .357 caliber revolvers 11.7% and 11.6% of the time respectively. 9mm
semiautomatic handguns such as a Glock were next with 8%.
Instead of taking guns away from law abiding citizens, the
emphasis needs to be on better gun security to reduce their access by criminals
and out of the hands of children as well as mandatory firearms training to reduce
accidental shootings.
Schools need to adopt better discipline standards in the
classroom as well as implement additional programs for pre and after school
activities. Curriculums need to include developing critical thinking skills and
civics. Adding community based volunteer
programs would also help.
The Justice System needs to reevaluate how it treats juveniles
arrested for crimes including shoplifting or bullying. Instead of slapping them
on the wrist and letting the go, juveniles need to bear responsibility for
their actions. There needs to be expanded rehabilitation programs for non-violent
first offenders and tax credits for potential employers. In addition to more
and better trained law enforcement,
there
needs to be a regular presence in not just high crime areas, but in schools and
government housing.
There needs to be an emphasis on keeping adult male parents in
the household of their children. However, in the absence of a proper male role
model, there needs to be more community based programs aimed at high risk
children such as Big Brother/Sister programs. More job based programs also need
to be introduced, including trade schools.
The approach we've been using since the 1970's obviously doesn't
work anymore, if indeed it ever really worked. Only by instilling a sense of
responsibility in youth of all races and ethnicity, better discipline in
schools, and providing access to opportunities can we ever hope to reduce the
current trend in violent crimes and produce more productive adults.
If you want to know more about
this article's topic, please check out the links below. If you enjoyed the
article, please consider passing it along to others and don't forget to
subscribe. It's free! Lastly please be sure to "like" us on
whatever platform you use to read anotheropinionblog.com. It
helps with the algorithms and keeps our articles in circulation. Thank
you!
FBI 2021 Hate Crime Statistics
U.S. DOJ Statistics on Race and Ethnicity of Violent CrimePerpetrators
Countries with the largest number of prisoners per 100,000of the national population as of January 2023
Prison Policy Initiative: Race and Ethnicity
Federal Bureau of Prisons: Inmate Age
Federal Bureau of Prisons: Inmate Statistics
Number of people shot to death by the police in the UnitedStates from 2017 to 2023 by race
Race and crime in the United States
DOJ: Guns Used in Crimes
National Institute of Justice: Preventing Crime: What Works,
What Doesn't, What's Promising