However, manipulating the data can and is often used in more deceiving ways too. It can be used to manufacture a desired outcome or create a certain impression. This is often the case in politics or the media when they try to persuade voters, legislators , or the general population to think, support, or vote a certain way.
I've long had an interest in applied (or predictive) social demographics and trends. Ever since I began working on my undergraduate degree in economics back in 1984, my fascination with demographics, trends, percentages and interpreting them has only grown as regular readers of A/O know ad nausem!
Recently I came across a recent study regarding patriotism and how would individuals respond to a invasion of America by some foreign power. What made the study particularly interesting is that the survey focused on registered voters belonging to one of the two corporate owned political parties, the Democrats and the Republicans along with the largest voting bloc, Independents.
A survey conducted in March 2022 by Connecticut's Quinnipiac University asked registered Republican and Democrat voters whether they would be willing to help defend in the United States in the event of a Ukrainian style invasion. Perhaps naively, I expected the answer would be an overwhelming "yes" regardless of party affiliation. I was surprised by the results.
When the question was posed to registered Republicans, 68% of the respondents said they'd help defend this country. While that's a pretty decent response, it also means that around 32% would bug out. I guess conservatism or protecting our way of life only goes so far.
It's worth noting that of the nation's largest political demographic, Independents, 57% said they'd stand and fight. As an aside, the same question was asked of active duty and reserve military personnel and veteran households. The majority---68%---would defend America, yet surprisingly 27% would bail with the rest undecided.
The survey also broke down the respondents by gender (sorry, but only two were available to pick from), race and age brackets. 75% of men would fight (there goes that "macho" thing again) while 40% of women would remain. The age bracket indicated that those 35 years and older were the ones most likely to take up arms and defend the country. 48% of those 34 and under (which covers mainly Millennials and Gen Z) said they'd hit the road.
Then we look at race, the poll lists only Black, White and Hispanic. Asians, Native Americans, and Pacific Islanders were evidently excluded because their percentages were too low. So, when examining the category of race, 57% of whites and 61% of Hispanics said they were willing fight while only 38% of black Americans would remain. 35% of whites, 33% of Hispanics and a whopping 59% of blacks said they'd leave.

Delving into that 43% percentage we find that Asians make up 10% of the military and another 15% belonged to a mixed or different races such as Native American. Hispanics made up 36% and are the fasting growing minority in the military. However, the largest minority---39%---serving in the Armed Forces were Black Americans. Meanwhile, 2/3 or 68.8% percent of active duty military are classified as white.
It's worth mentioning that out of the 3,535 Medal of Honor Awards given, 94 went to black military personnel. 61 individuals of Hispanic origin have won the Medial Honor while 22 Native Americans have shared that honor. 35 Asian or Pacific Islanders have also been so honored. As an aside, out of the 3,535 Medal of Honor recipients, only 103 are still alive. Most were award for their valor during the Civil War. The second highest was in World War II followed by the "Indian Wars" and the Vietnam War.
Given the original survey question and the resulting data raises an interesting question. I wonder what would happen if China for instance would attempt an invasion. Would we react to the Chinese-Americans the way we did to Japanese-Americans during WWII? For those unfamiliar with the history of that era, following the attack on Pearl Harbor in 1941 by Japan, the U.S. ordered the incarceration of all Japanese living in America, citizen or not. They were held in what could be at best called "concentration camps".

Hispanics are the second largest population (and rapidly growing) behind whites account for just under 19% of the total U.S. population or approximately 62.1 million Hispanics or individuals of Hispanic origin in the U.S.. However, based on their population size, they are heavily underrepresented in our military, but according to survey, most Hispanics---61%---are willing to defend this country.
So, what can we glean from the above information? Well, according to the survey the majority of males who are of white or Hispanic origin, middle age or older and are either Republican and/or conservative as well as the predominantly centrist Independents are most likely to come to America's defense should the nation need them.
The least likely are women of any race, Black Americans, and those 34 and under (which intriguingly comprises Millennials and Gen Z. Those are the two generations replacing us aging Babyboomers and Gen Xers) and Democrats, which presumably encompasses progressives or liberals well.
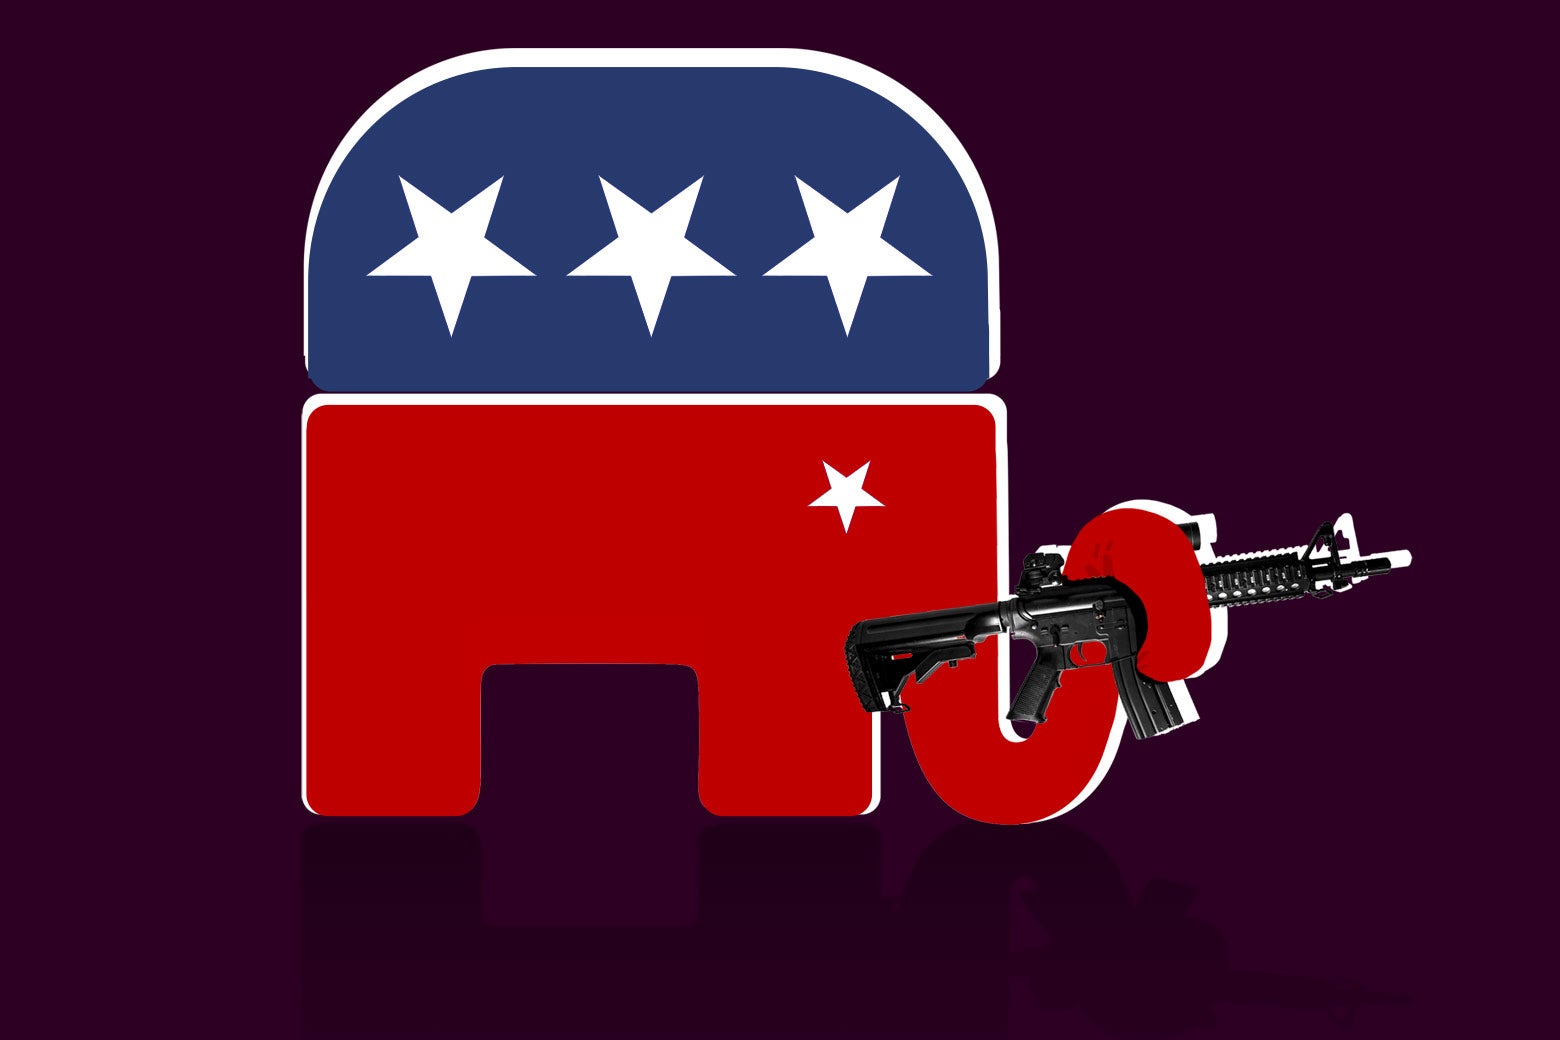
By contrast, only 20% of Democrats have a gun. Just 32% acknowledged one being in their home. So, taken all together, I guess if the proverbial "SHTF" should ever occur, you know who's most likely to make a stand to protect this country, and who knows, maybe your butt too. Just saying.
If you
enjoyed the article, please consider passing it along to others and don't
forget to subscribe. It's free! Lastly please be sure to
"like" us on whatever platform you use to read anotheropinionblog.com. It helps beat the algorithms and keeps our
articles in circulation. Thank you!
Quinnipiac University Poll March 7, 2022
USNI News: Department of Defense Demographic Profile
Latinos Claim Larger Share of U.S. Military Personnel
Black Americans In The U.S. Army
United States Army: Medal of Honor Award
No comments:
Post a Comment