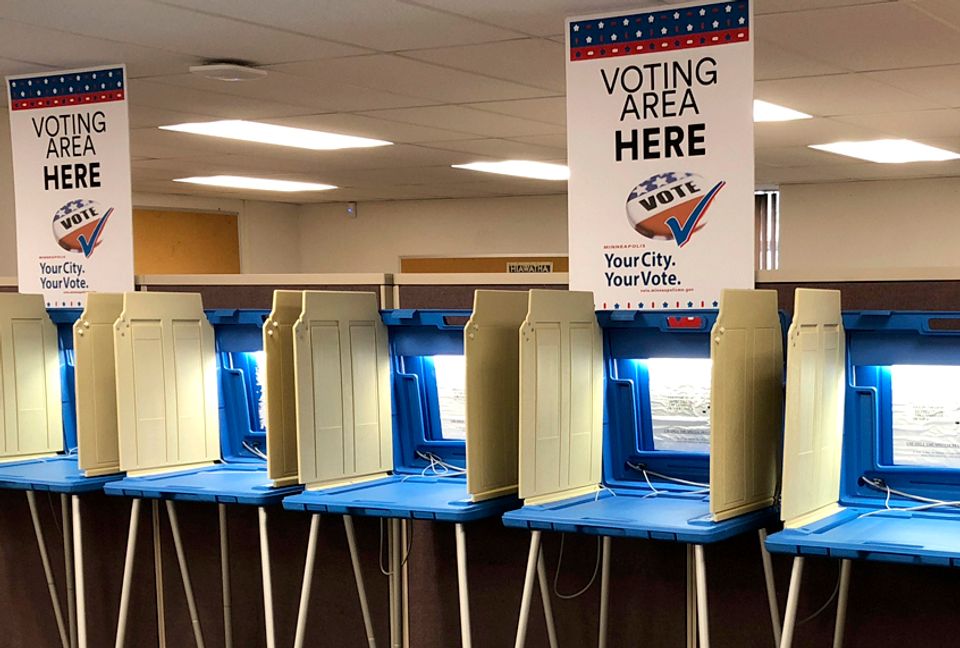
Other democracies have a far greater percentage of voter turnout that we do (we're ranked 31st in the world). For many people it means trudging on foot for miles enduring all kinds of terrain and weather, through dangerous areas controlled by drug cartels, terrorists, corrupt police and military troops, all trying to intimidate voters. But Americans, it seems we will stay home at the drop of a hat. Any ole excuse will do. Is it that we just don't care anymore? Who does show up to vote? Let's look at the numbers.
Voter turnout in the United States in the 2020 presidential election was 66.1%. Of the eligible 240 million voters, 158,427,986 bothered to show up (and of that, an estimated 5% of the votes were cast by illegal immigrants). Colorado, Maine, Minnesota, Wisconsin, Washington State and Oregon had the highest percentage of turnout with 75% or better of eligible voters showing up at the polls. Hawaii, Oklahoma, Tennessee, Missouri, and West Virginia had the lowest turnout---under 55%---of registered voters.
Historically, voter turnout for presidential elections has been in the neighborhood of 55%. The lowest turnout since 1932 was in 1996 when just 49% of the voting age population showed up to decide between between Bill Clinton, Bob Dole, and Ross Perot. Clinton won with 49% of the vote, Dole received 40.7% and Ross Perot got 8.4%.
As an aside, the lowest voter turnout in U.S. history was the 1792 presidential election between George Washington (seeking a second term) and John Adams. The turnout was just 6.3% (or 28,000 voters out of a population of 3,919,023). Of course, there were only 15 states back then. Apparently being "Father of the Country" didn't count for much.

The highest voter turnout at the polls was in 1876 when 82.6% of eligible voters showed up to vote for Rutherford Hayes or Samuel Tilden. This was one of the earliest elections to allow former slaves to vote following the passage of the 15th Amendment in 1870.
Although America has had a wide variety of political parties since 1790, the two main parties nowadays are the Republicans and Democrats, although there are several strong third parties which include the Libertarian Party, the Green Party, and the Constitution Party (according to a October 4, 2023 Gallup report, support for third parties is up 63%, the highest increase since 2003).
Nevertheless, both of the two major parties have been hemorrhaging voters, especially since the Supreme Court upheld the "Citizens United" ruling in 2010 which effectively gave over control of the U.S. political system to corporations by declaring they had "personhood" and basic civil rights. It also declared money was "free speech", and without a cap on donations, they could give what they wanted. That meant the few would have more "free speech" than the many.
For about the last 10 or so years, voters have shifted away from the growing extremism of either corporate owned party and becoming Independents or joining third parties. Today, registered Independents make up about 41% of all registered voters with the Democrats and Republicans comprising 28% and 31% respectively (Independents were as high as 51% in June 2024).
According to a Pew survey, in 2020 48% of registered male voters who showed up voted Democrat compared to 55% of females. 50% of registered Republican males voted while 44% of Republican women did. In 2022, a presidential off year, 44% of male Democrats voted as did 51% of Democratic women. So, in both instances, Republican males showed up more than Democratic males. Among females, the opposite was true. More female Democrats voted than Republicans.
The survey left out the political majority---Independents (does that subtlety imply a measure of partisanship I wonder?), which is interesting given that Independents made up over a quarter of all voters who showed up at the polls in 2020. Independents tend to lean conservative when it comes to the economy and taxes and lean liberal on most social issues. Independents are, to frame them, typically moderates. They oppose the extremism of the prevailing duopoly.
When it comes to voting, Independents look at individual candidates and their positions on specific issues compared to their partisan counterparts who tend to vote along party lines (even if it means holding their noses to do so). For instance, in 2022 Democrats voted for Democratic candidates 96% of the time with just 3% refusing to walk in lockstep.

What does this mean? In 2022, 74% of voters disapproved of how Biden was handling (or mishandling as the case may be) of the economy. Given the lockstep mentality of both parties, and their near dead heat in voter registration, it will be the Independents who may decide the 2024 election and do so into the future. The question is which, if any, of the two corporate owned parties can pull in the Independent voter? Independents are political "free agents" and the Democrats and Republicans aren't the only game anymore.
According to a CNN poll, Democratic voters between ages 18 and 29 and 30 to 39 turned out in heavy percentages---63% and 51% respectively---then the percentages drop off significantly to the mid and lower 40% range. Among Republicans, the inverse was true. The percentages for the same age brackets were 35% and 47%. Ages 40 and older saw the numbers jump to about 55%.
Married Republicans voted 58% of time compared to 39% who are single. For Democrats, just 41% of married couples voted. But if you're single, that percentage jumps to 59%! So, in looking at these two sets of statistics provided by CNN, young single Democrats are more likely than not to show up at the polls. On the other hand, older married Republicans are most likely to be dedicated voters.
Looking backward, although the historical affiliation among the youth vote has been Democrat, it has been by decreasing margins coming forward. If Pew had included Independents, the data would have shown that the general trend among the youth in both parties are deserting the two corporate parties in droves and becoming Independent. As an aside, almost 50/50% favor some form libertarianism or type of social democracy. Support for traditional capitalism is also in decline.

Hispanics, who are now the second largest population in the U.S., voted 61% Democrat in 2020. 36% backed Republicans (most were of Cuban descent). Those number changed slightly in 2022 when 60% voted Democrat and 39% when Republican. Asians weren't much different. 70% voted Democrat in 2020 compared to 30% Republican. 2022 saw 68% going Democrat and 32% voting Republican.
If we look at race and gender, 60% of white males voted Republican in 2022. 38% voted Democrat. Among white females, 55% voted for the GOP in 2022 while 44% sided with the Democrats. Among Black males, 93% backed Democrats while just 6% supported the Republican Party. Black women were nearly identical with the male counterparts. 93% went Democrat and 5% back Republicans.
Among Hispanic males in 2022, 43% sided with Republicans. 56% back the Democratic Party (one reason may be for the perceived leniency toward illegal immigration and less willingness to deport compare to the Republicans). It appears that 64% of Hispanic females agree. 34% side with the Republicans. Unfortunately, there was no data for Asians.
In the 2022 election, individuals with a high school or less level of education leaned Republican by a margin of 59% to 39%. Those with an associate degree favored the GOP by 54% to 44%. However, those with a four year degree favored Democrats to Republicans, albeit narrowly, 51% to 48%. For those with a Master's degree or better, 61% voted Democrat versus 37% went for the Republicans.

When it comes to income, more lower income families are registered Democrat than Republican, and they're also more likely to vote. 58% compared to 36%. Among upper middle class voters, 52% will turn out for Republicans compared to 46% for Democrats. Meanwhile, the very wealthy actually show up for Democrats over the Republicans 53% to 46%. It appears that the average Republican voter is someone with a lower middle to upper middle class (the very class which is decreasing the rapidest).
As an aside, union members are more likely to be registered Democrat (59%) than Republican (39%) although the Democratic Party depends on corporate dollars. Among non-union voters, it's almost a even split with 48% Democrat and 49% Republican. Most renters are Democrat compared to Republican (64% to 32%) whereas most homeowners vote Republican (51%) as opposed to Democrat (45%).
When it comes to military service, 63% of veterans vote Republican while 51% of non-military tend toward the Democrats. 72% of white veterans lean Republican but 82% of Black veterans are Democrat. Similar numbers hold true for those who attend church regularly. The majority of white churchgoers---59%---tend to vote Republican while Black churchgoers vote Democrat in near equal numbers.
So, there you have a snapshot of the average American voter. Women are more likely than men to show up at the polls to vote. The older the voter, the more likely they'll vote. Higher education doesn't equate to more conservative voting. Those with a high school (or trade school degree) are more likely to turn out to vote than someone with bachelor or higher degree.

The voters of 2024 won't be much different from the voters of 2022, except that turnout will likely be higher. Right now the polling numbers show a virtual dead heat. Will it be who can get their side out in numbers that stands the best chance of winning? Is it who can swing the Independent vote that will win? Personally, I think Joseph Stalin had it right when he allegedly said "those who vote decide nothing. Those who count the votes decide everything", but then that's a problem we've been experiencing with greater frequency isn't it
Thank you
for reading Another Opinion! We hope you enjoyed this article and will
pass it along. Please don't forget to subscribe. It's free! Lastly, please
"like" us on whatever platform you use to read anotheropinionblog.com. It helps beat the
algorithms and keeps our articles in circulation. Please find below the links
we consulted in researching this article.
Voting Patterns in the 2022 Elections
Voter turnout in United States presidential elections
Gallup: Party Affiliation Week of October 1, 2024
Women's Suffrage in the United States
Gender Differences in Voter Turnout
Independent Voters Have the Final, and Future, Say
Conservative Faculty are Outliers on Campus Today
Partisanship by family income, home ownership, unionmembership, and veteran status
Most White Americans who regularly attend worship servicesvoted for Trump in 2020
Support for Third U.S. Political Party Up to 63%
No comments:
Post a Comment